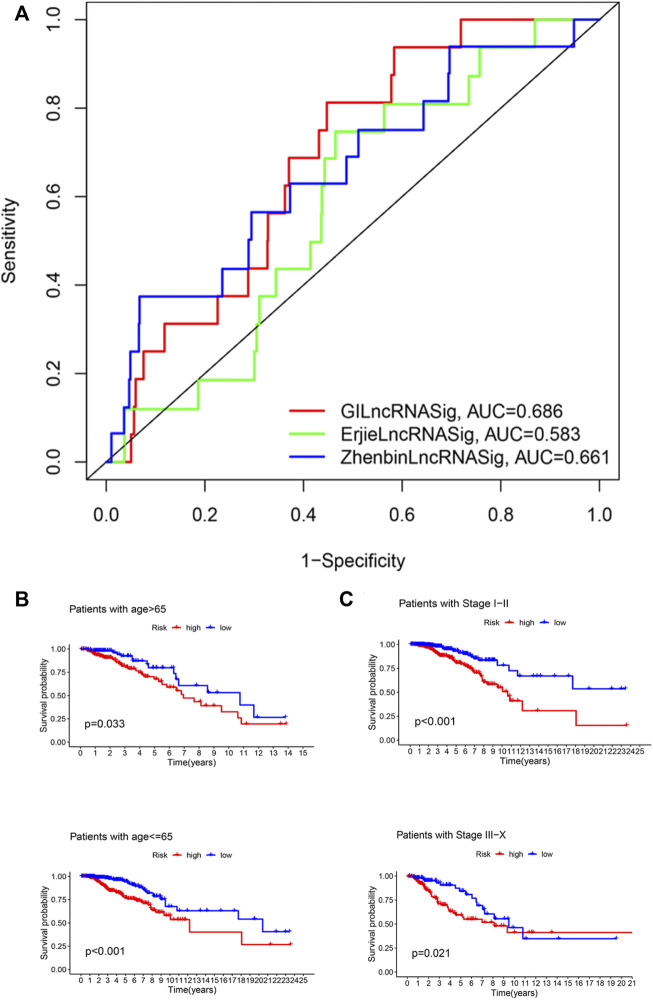
FIGURE 5.
Identification of the efficiency of GILncRNASig in clinical characteristics. (A). Comparison of the time-dependent ROC curve with other characteristic-related lncRNAs model. (B). Kaplan–Meier curves of overall survival of patients between low- and high-risk groups in patients with Age <65 and Age ≥65. (C). Kaplan–Meier curves of overall survival of patients between low- and high-risk groups in patients with Stage I–II and Stage III–IV.

