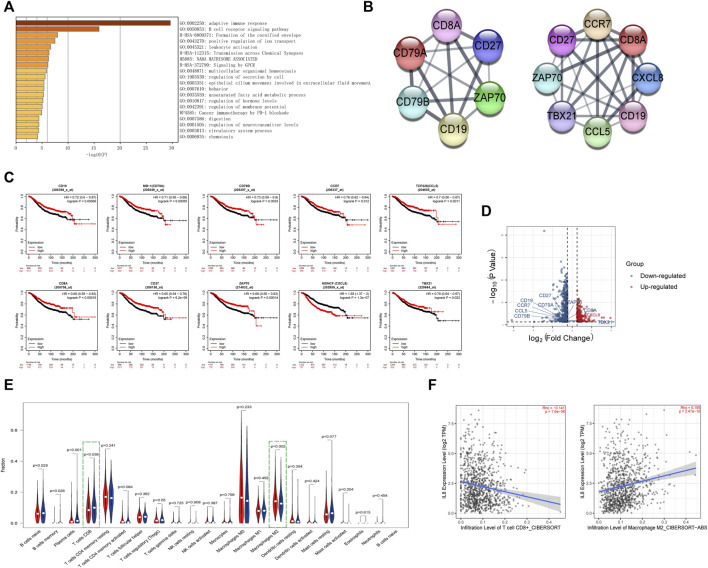
FIGURE 6.
Identification of the immune-related pathways involved in the differentially expressed genes between high- and low-risk groups.(A). The enrichment pathways for the differentially expressed genes between the high- and low-risk groups. (B). The hub genes related to the adaptive immune pathway and the B-cell receptor signaling pathway. (C). Kaplan–Meier curves of overall survival of the hub genes for breast cancer patients in Kaplan-Meier Plotter database. (D). Volcano plot of hub genes between the high- and low-risk groups. The right red labeled gene was significantly higher in the high-risk group than the low-risk group, and the left blue labeled genes were significantly lower in the high-risk group than the low-risk group. (E). Boxplot of the infiltration level of immune-associated cells in the high- and low-risk groups. (F). The expression of CXCL8 was negatively correlated with CD8+ T cell infiltration and positively correlated with M2 macrophage infiltration in TIMER 2.0 database.

