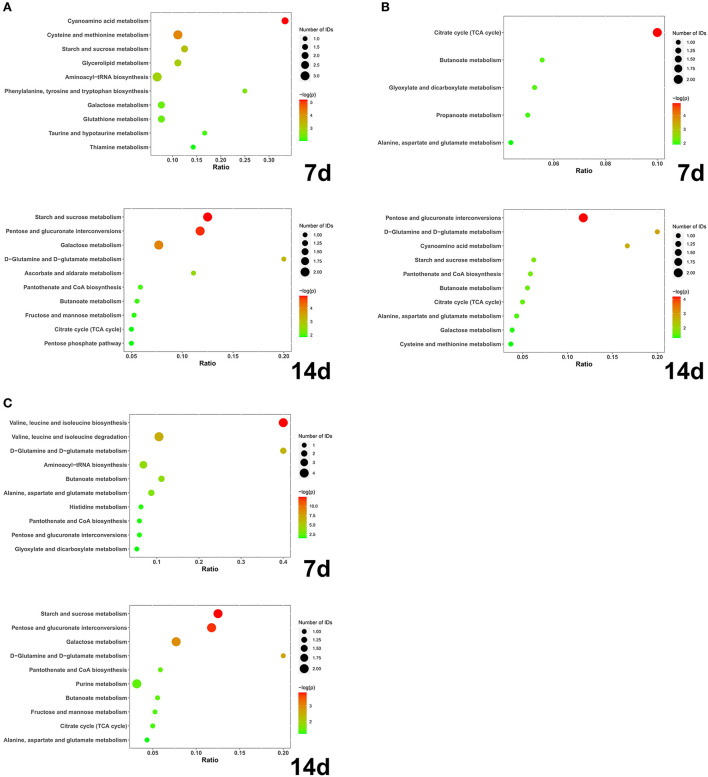
Figure 4.
(A) IS-C; (B) EE-IS; (C) APS-IS. The abscissa axis Ratio represents the ratio of differential metabolites enriched to this metabolic pathway to total metabolites; the size of bubbles represents the number of differential metabolites enriched to this metabolic pathway; the larger the -log(P), the smaller the P-value and the more significant the difference (N = 5).

