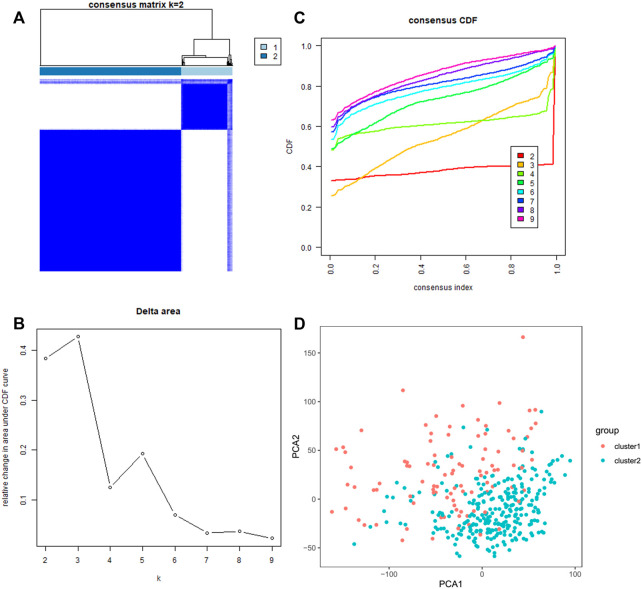
FIGURE 2.
Consistent clustering analyses of the HCC. (A) The correlations between subgroups when the number of clusters is k = 2. (B) Cumulative distribution function (CDF) for k = 2–9 is displayed. (C) The relative variation of the area under the CDF curve of k = 2–9. (D) Principal component analysis of the RNA-seq data. Red dots stand for cluster 1, and cyan dots stand for cluster 2.

