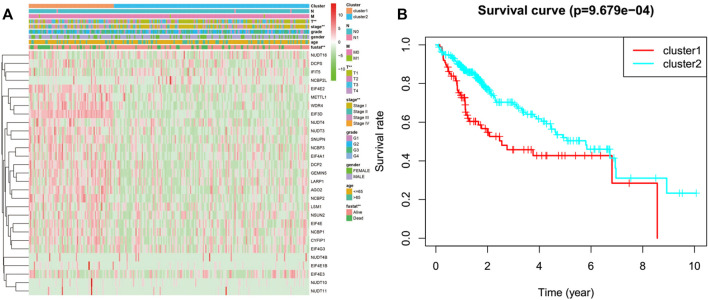
FIGURE 3.
Differences between cluster one and cluster two in clinicopathological features and overall survival. (A) Heatmap and clinicopathological features of the two clusters. Green stands for low expressions, and red stands for high expressions. (B) Compare the overall survival (OS) distribution of cluster one and cluster 2. *p < 0.05, ***p < 0.001.

