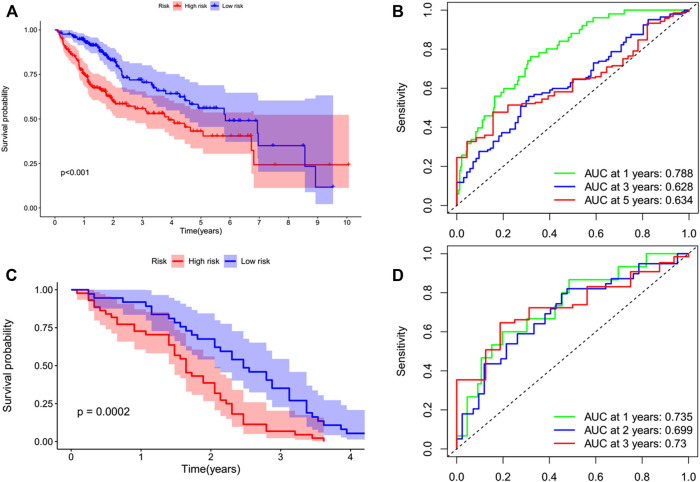
FIGURE 6.
Kaplan–Meier survival analysis of the prognostic model. Invalids in both datasets were divided into high-risk (red) and low-risk (blue) groups, applying the median risk score as the threshold. (A,B) In the TCGA cohort, the survival probability of the low-risk group was higher than that of the high-risk group (p < 0.001). The AUCs at 1-, 3-, and 5-years were 0.788, 0.628, and 0.634, respectively. (C,D) This prognostic model was verified in the GEO cohort. The survival probability of low-risk group was higher than that of high-risk group (p = 0.0002). The AUCs at 1 year, 2 years, and 3 years were 0.735, 0.699, and 0.73, respectively.

