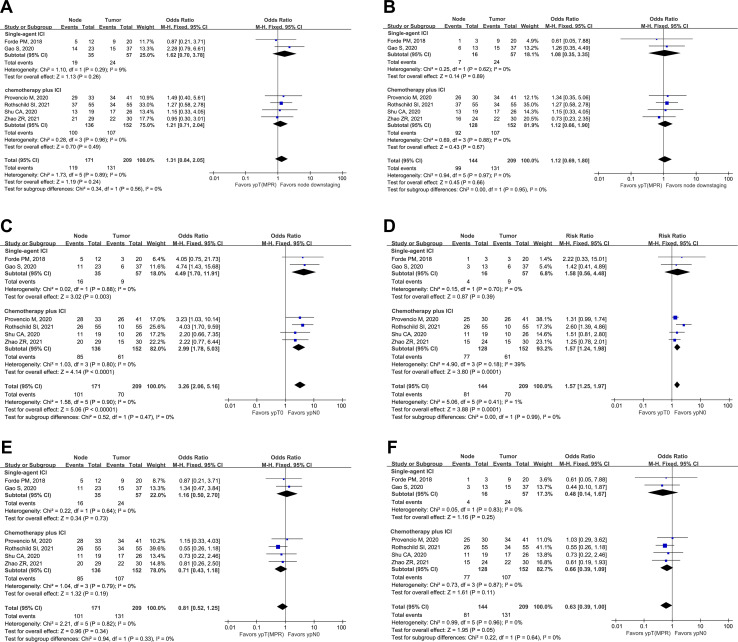
Figure 1.
Forest plots showing ypT(MPR) versus node downstaging following neoadjuvant immunotherapy in the entire cohort (A) and cN2-only population (B). forest plots showing ypT0 versus ypN0 following neoadjuvant immunotherapy in the entire cohort (C) and cN2-only population (D). forest plots showing Ypt (MPR) versus ypN0 following neoadjuvant immunotherapy in the entire cohort (E) and cN2-only population (F). ICI, immune checkpoint inhibitor; MPR, major pathological response.

