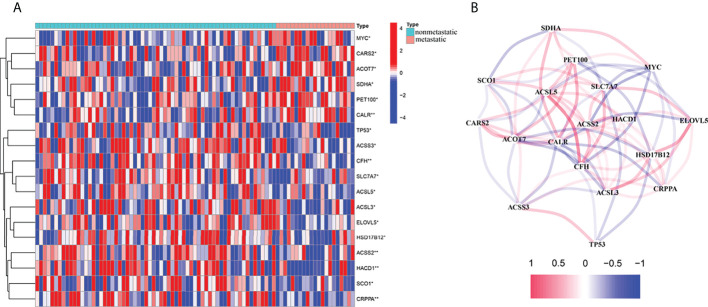
Figure 1.
Expressions of the 18 fatty acid and lactate metabolism–related genes and the interactions among them. (A) Heat map (blue: low expression level; red: high expression level) of the fatty acid and lactate metabolism–related genes between the non-metastatic (nonmetastatic, brilliant blue) and the metastatic tissues (metastatic, red). P-values were showed as *P < 0.05; **P < 0.01. (B) The correlation network of these genes (Cutoff = 0.1; red line: positive correlation; blue line: negative correlation).

