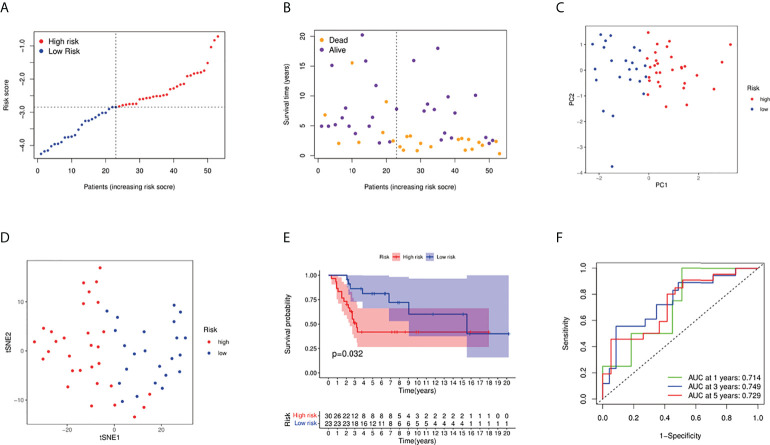
Figure 4.
Validation of the risk model in the GEO cohort. (A) Distribution of patients in the GEO cohort based on the median risk score in the TARGET cohort. (B) The survival status of low-risk and high-risk population. (C) PCA plot for osteosarcoma patients. (D) The t-SNE analysis based on the risk score. (E) Kaplan–Meier curves for comparison of the overall survival between low- and high-risk groups; (F) Time-dependent ROC curves for osteosarcoma patients.

