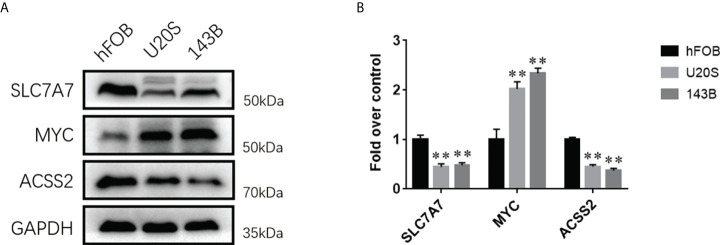
Figure 5.
The expression levels of fatty acid and lactate metabolism related genes between osteosarcoma cell lines and osteoblasts. (A) Western blotting analysis of the expressions of SLC7A7, MYC, and ACSS2 proteins in hFOB, U20S, and 143B groups. GAPDH serves as an internal standard. The gels have been run under the same experimental conditions. (B) A histogram of the OD values of SLC7A7, MYC, and ACSS2 in each group (n = 3 per group). The obtained data are represented as M ± SE. Significance: **p < 0.01 versus hFOB group.

