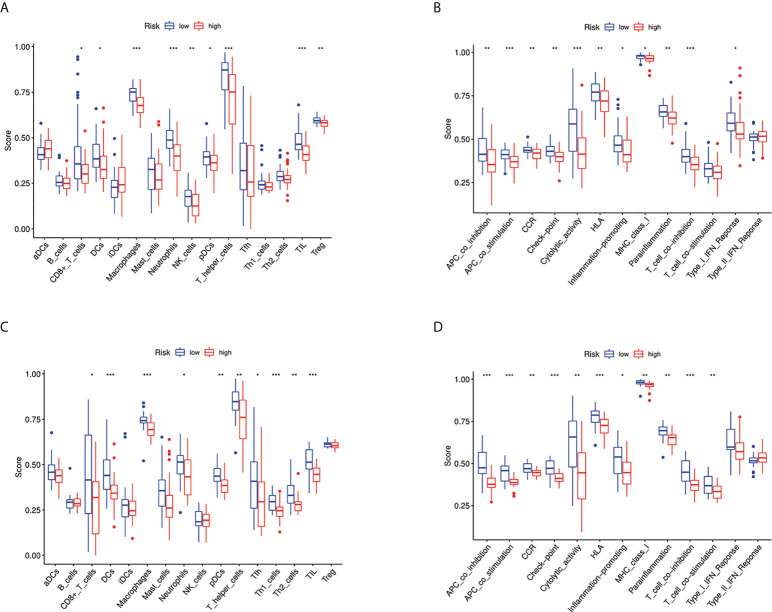
Figure 9.
Immune status between different risk groups and the association between risk score and tumor microenvironment. (A) Comparison of the enrichment scores of 16 types of immune cells between low- (blue box) and high-risk (red box) group in the TARGET cohort. *p < 0.05, **p < 0.01, and ***p < 0.001; (B) Comparison of the enrichment scores of 13 types of immune functions between low- (blue box) and high-risk (red box) group in the TARGET cohort. *p < 0.05, **p < 0.01, and ***p < 0.001; (C) Comparison of the enrichment scores of 16 types of immune cells between low- (blue box) and high-risk (red box) group in the GEO cohort. *p < 0.05, **p < 0.01, and ***p < 0.001; (D) Comparison of the enrichment scores of 13 types of immune functions between low- (blue box) and high-risk (red box) group in the GEO cohort. *p < 0.05, **p < 0.01, and ***p < 0.001.

