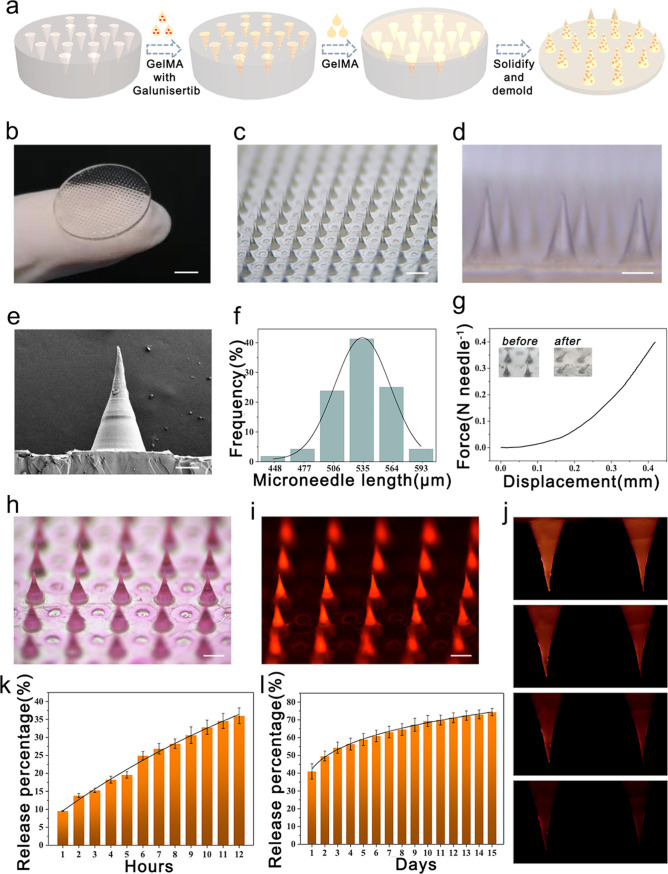
Figure 1.
Characterization of the galunisertib-loaded GelMA MN patch. (a) Schematic diagram of the fabrication of MN patches. (b) Digital photo of the whole MN patch; scale bar: 4 mm. (c–d) Microscopic images of MNs; scale bars: 600 μm in (c) and 260 μm in (d). (e) SEM image of a single MN; scale bar: 100 μm. (f) Uniformity statistics of MNs. (g) Compressive mechanical performance of MN patches. (h–i) Optical and fluorescence microscopic images of the MN patch loaded with Rhodamine B; scale bars: 300 μm. (j) Fluorescence photographs of the release status of MNs; scale bar: 150 μm. (k–l) Accumulative Rhodamine B release percentage from MNs in the first 12 h (k) and next 15 days (l).

