Figure 5.
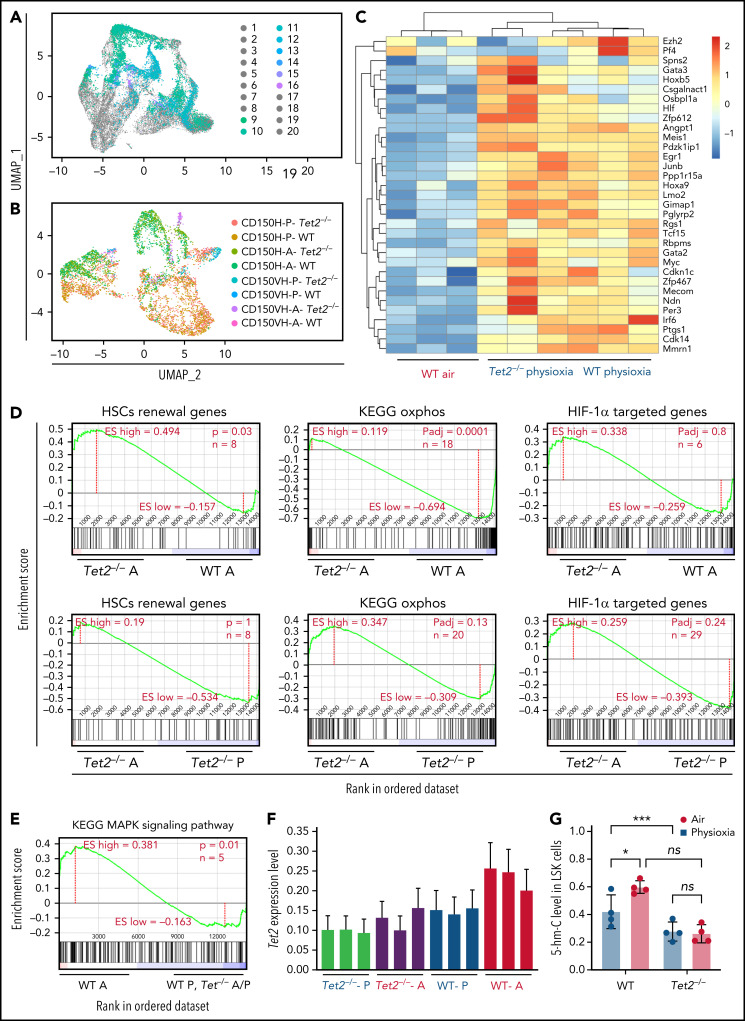
Surface proteins and transcriptomic changes in WT and Tet2−/− LSK cells in response to ambient air exposure. (A) Two-dimensional UMAP visualization of the full scRNA-seq data, in which samples were colored by the cell type determined by surface proteins and experimental conditions. (1) Tet2−/−CD150-CD117-physioxia, (2) WT CD150-CD117-physioxia, (3) Tet2−/−CD150-CD117-air, (4) WT CD150-CD117-air, (5) Tet2−/−CD150-CD117-CD48-physioxia, (6) WT CD150-CD117-CD48-physioxia, (7) Tet2−/−CD150-CD117_ CD48-air, (8) WT CD150-CD117-CD48-air, (9) Tet2−/−CD150-physioxia, (10) WT CD150-physioxia, (11) Tet2−/−CD150-air, (12) WT CD150-air, (13) Tet2−/−CD150-very high-physioxia, (14) WT CD150 very high-physioxia, (15) Tet2−/−CD150 very high-air, (16) WT CD150 vey high-air, (17) Tet2−/−CD48-physioxia, (18) WT CD48-physioxia, (19) Tet2−/−CD48-air, (20) WT CD48-air. (B) UMAP of LSK-CD150hi cells collected from the 4 conditions. (C) Heatmap of select HSC renewal and marker genes that are differentially expressed in Tet2−/− LSK-CD150hi-physioxia, and WT LSK-CD150hi-physioxia/air cells. (D-E) GSEA plots of select differentially expressed pathways between Tet2−/− LSK CD150hi-air cells and WT LSK-CD150hi-air cells. (F) Expression status of Tet2 in the CD150hi cells in physioxia and ambient air. (G) 5-hmC levels in WT and Tet2−/− LSK cells under physioxia and ambient air. Data are presented as mean ± standard error of the mean. *P < .05; ***P < .001 when analyzed by 2-way ANOVA with a post hoc Tukey’s multiple comparison test. A combination of 2 independent experiments is shown. KEGG, Kyoto Encyclopedia of Genes and Genomes; ns, not significant; Tet2−/−A, Tet2−/− air; Tet2−/− P, Tet2−/− physioxia; UMAP, Uniform Manifold Approximation and Projection; WT A, WT air; WT P, WT physioxia.

