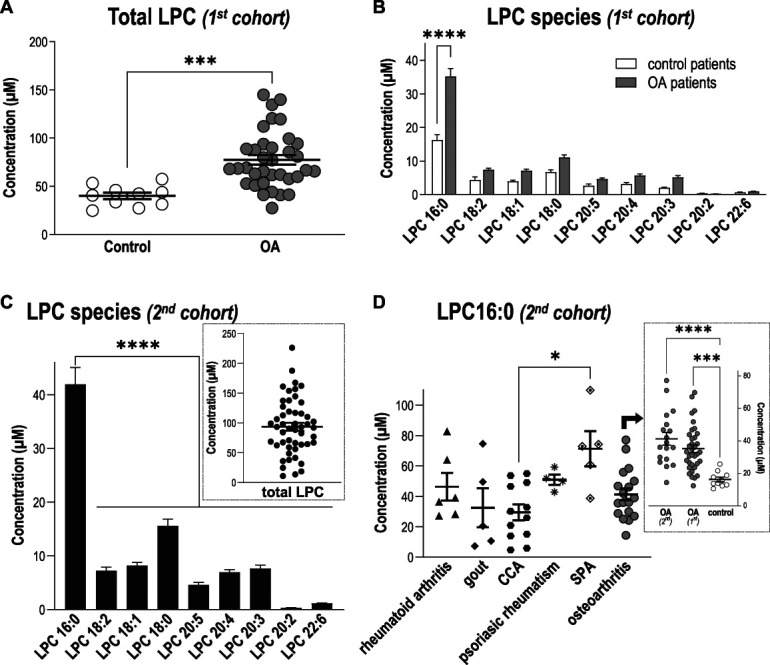
Figure 1.

Levels of LPC16:0 are increased in synovial fluids of patients suffering from joint pain. Quantifications of LPC species were performed in knee human synovial fluid (HSF) samples. Total lipids were extracted from HSF samples and analyzed by direct infusion in mass spectrometry (MS) using an electrospray ionization source (ESI) in the positive ion mode (see “Methods” section for details). (A) Comparison of total LPC concentrations (µM) between a first cohort of patients with osteoarthritis (OA, n = 35 patients) and postmortem control subjects (n = 10), showing significantly higher levels of LPC in patients compared with control specimens (***P = 0,0003, unpaired t test). (B) Distribution of the different LPC species concentrations (µM) in the HSF of OA patients and postmortem control specimens. Although mean concentrations of most LPC species were higher in the HSF of OA patients, LPC16:0 was the most abundant and the only one to be significantly elevated compared with postmortem control subjects (***P < 0.0001, 2-way ANOVA followed by a Sidak multiple comparison test). (C) Distribution of the different LPC species concentrations (µM) in the HSF of a second cohort of patients suffering from different joint pathologies (n = 50), showing significantly higher level of LPC16:0 compared with the others species (****P < 0.0001, One-way ANOVA followed by a Dunnet multiple comparison test). Inset: Total LPC concentration in HSF of the second cohort of patients. (D) LPC16:0 concentrations in the different subgroups of patients from the second cohort: rheumatoid arthritis (RA, n = 6), gout (n = 5), CCA (n = 12), psoriatic arthritis (n = 4), SPA (n = 5), and OA (n = 18). The LPC16:0 concentrations in all the different subgroups of patients are comparable, except a difference between CCA and SPA (*, P < 0.05, Kruskal–Wallis test followed by a Dunn multiple comparison test). Inset: LPC16:0 concentrations in HSF of OA patients from the first and second cohort are similar and higher than control postmortem (***P < 0.001 and ****P < 0.0001, 1-way ANOVA followed by a Tukey multiple comparison test). ANOVA, analysis of variance; CCA, chondrocalcinosis; HSF, human synovial fluid; LPC, lysophosphatidylcholine; OA, osteoarthritis; SPA, spondyloarthritis.
