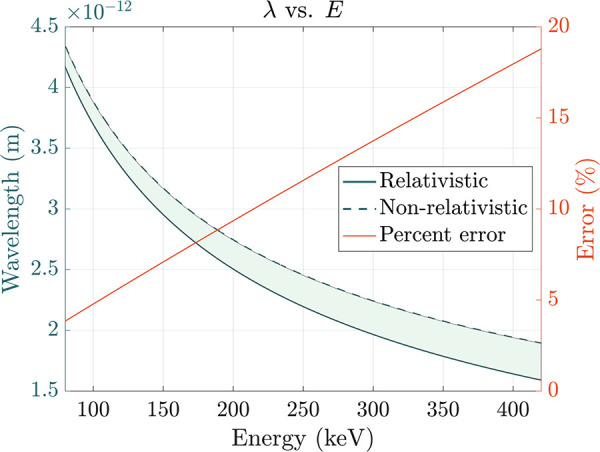
Figure 2.

Relativistic (solid blue line) and nonrelativistic (dashed blue line) electron wavelengths plotted as a function of incident energy (E) at a range of accelerating voltages accessible to TEM. Percent error between the two calculations is plotted in orange; characteristic values include ∼4.7% at 100 keV, ∼9.3% at 200 keV, ∼13.7% at 300 keV, and ∼17.9% at 400 keV.
