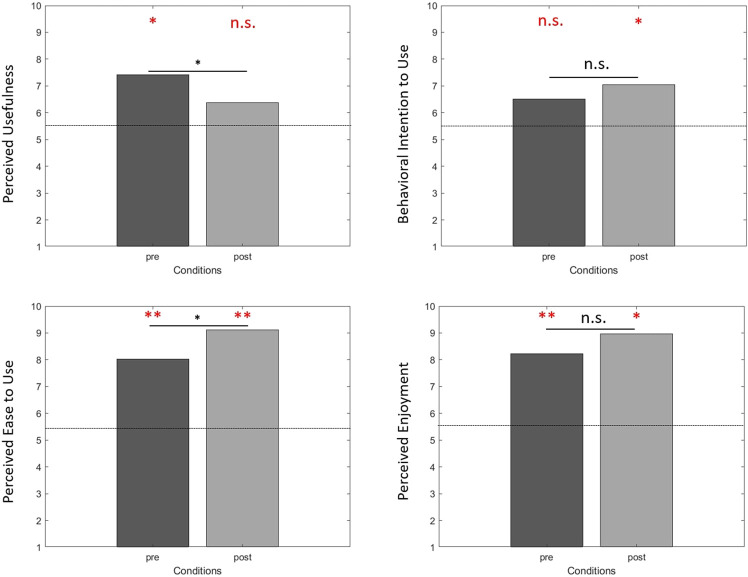
FIGURE 11.
Acceptance of the virtual reality device before (pre) and after use (post). Analyses revealed that only PU after use (p = 0.217) and BIU before use (p = 0.184) were not different from the mean of the scale (i.e., dotted lines). Analyses showed differences between before and after use for PU (p = 0.007) and PEU (p = 0.033). n. s. no difference; *p < 0.05; **p < 0.001. In red, compared with the mean of the scale. In black, between conditions analyses.

