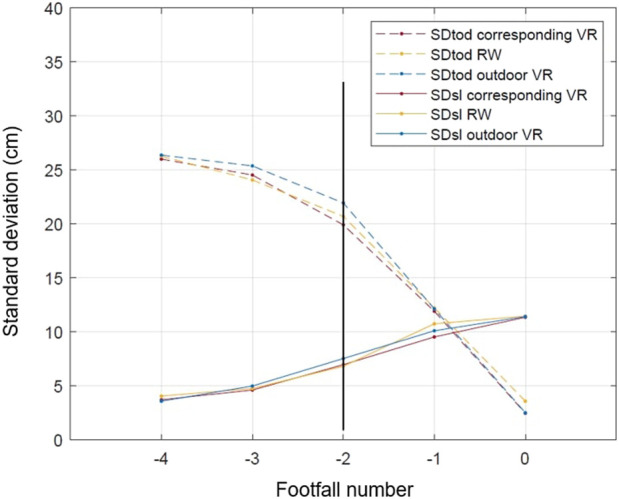
FIGURE 9.

Patterns of the standard deviation of toe-obstacle distances and of step lengths as functions of footfall number. The black vertical line marks the onset of step adjustments at footfall −2. Footfall 0 is the pointing footfall. SDtod: standard deviation of toe-obstacle distances; SDsl: standard deviation of step lengths; VR: virtual reality; RW: real world.
