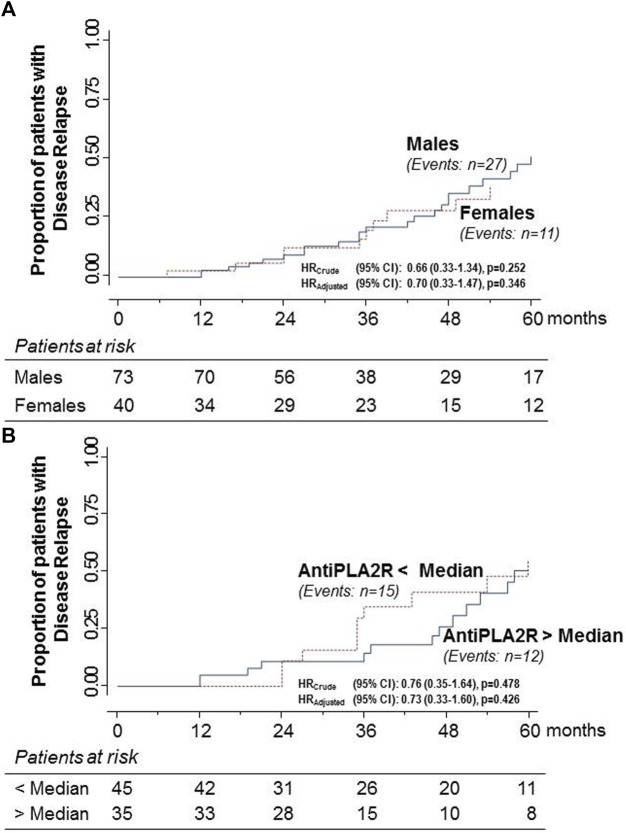
FIGURE 5.
Kaplan–Meier curves for the proportion of participants with primary MN who had a relapse of the NS after progression to the combined endpoint of complete or partial remission in males and females (A) and in patients with anti-PLA2R antibody titer above or below the median (B) considered separately. Relapse rates never differed significantly between considered groups.

