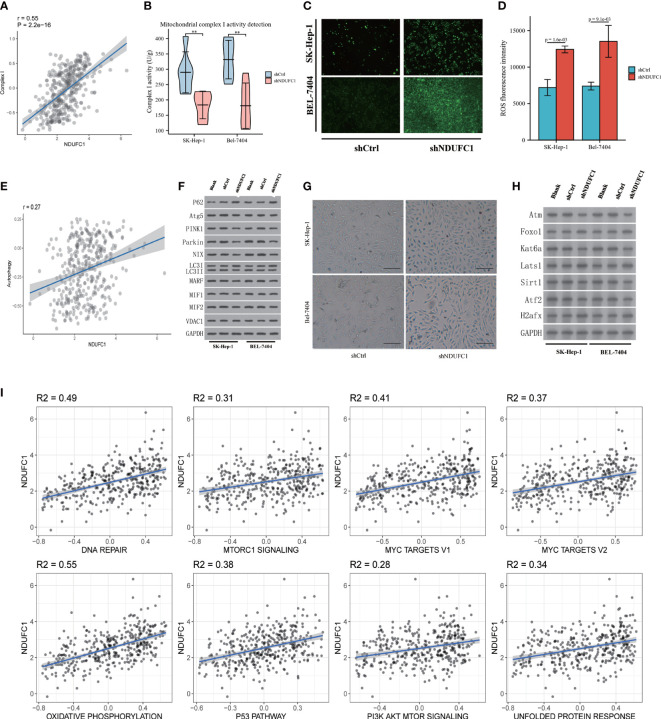
Figure 4.
Tumor biological function of NDUFC1. (A) Bioinformatic analysis found positive correleation between Complex I and NDUFC1. (B) shNDUFC1 cell lines could inhibit the function of Complex I (C) ROS burden is up-regulated after NDUFC1 was knock down cell lines. (D) ROS flow cytometry assay showed that shNDUFC1 increased ROS burden. (E) Bioinformatic analysis found NDUFC1 is correlated with Autophagy. (F) shNDUFC1 could reduce autophagy in HCC cell lines. (G) SA-β-Gal analysis showed that shNDUFC1 induced senescence characteristics in SK-Hep-1 and Bel-7404. (bar = 100 μm). (H) Senescence related protein was correlated with NDUFC1 expression. (I) Cancer-associated cellular pathways analysis by NDUFC1 expression. MSigDB (http://www.gsea-msigdb.org/gsea/index.jsp) were used to analysis the cancer associated cellular pathways. The positive correlation analysis was found between NDUFC1 and multiple cancer-related pathways (R2 > 0.25 was considered as an interaction relationship). There was no negative correlation between NDUFC1 and multiple cancer-related pathways. **P < 0.01.

