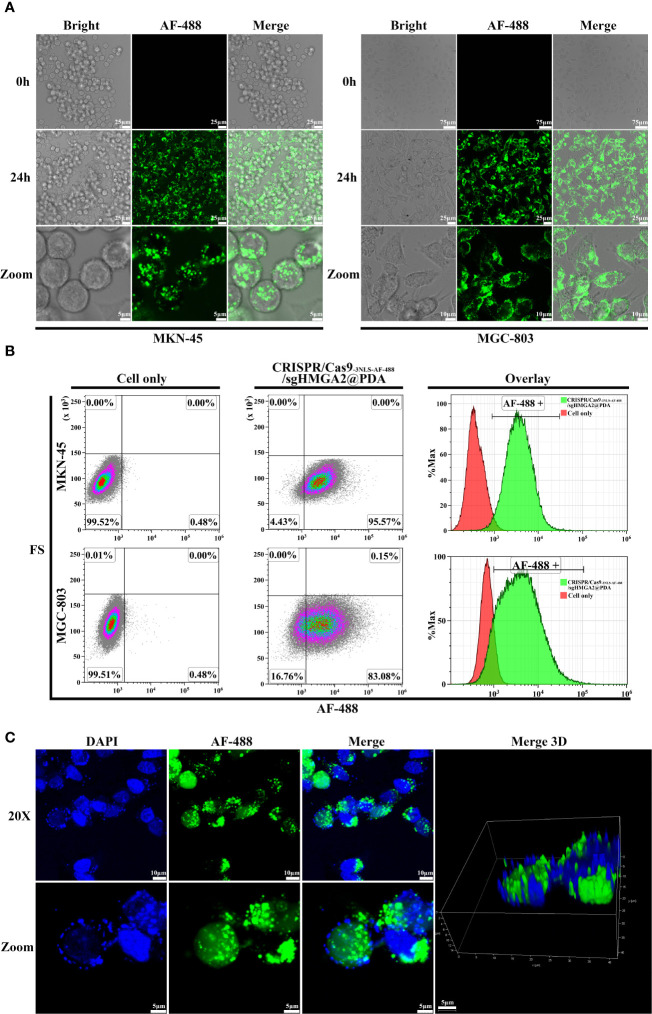
Figure 4.
Intracellular and nucleus delivery of CRISPR/Cas9-3NLS/sgHMGA2@PDA (A) Intracellular delivery of CRISPR/Cas9-3NLS/sgHMGA2@PDA by confocal laser scanning microscopy. From the left to the right, combining images are MKN-45 and MGC-803 cells after co-incubation with CRISPR/Cas9-3NLS/sgHMGA2@PDA, respectively. First column of left image: bright-filled; second column: AF-488 fluorescence; third column: merged images. The upper line: 0 h after co-incubation, 20×; the middle: 24 h after co-incubation, 40×; the bottom: the magnified images of upper images. (B) Intracellular delivery of CRISPR/Cas9-3NLS/sgHMGA2@PDA by flow cytometry. The upper and bottom lines are MKN-45 and MGC-803 cells after co-incubation with CRISPR/Cas9-3NLS/sgHMGA2@PDA for 24 h, respectively; first column: cell only; second column: cells co-incubated with CRISPR/Cas9-3NLS/sgHMGA2@PDA; third column: overlay of the two images. AF-488 positive indicates the cells delivered successfully by CRISPR/Cas9-3NLS/sgHMGA2@PDA. (C) Nucleus delivery of CRISPR/Cas9-3NLS/sgHMGA2@PDA into MKN-45 cells by confocal laser scanning microscopy. First column: DAPI staining images; second column: AF-488 fluorescence images; third column: merged images of DAPI staining and AF-488 fluorescence; fourth column: 3D merged images of DAPI staining and AF-488 fluorescence; the upper: 24 h after co-incubation with CRISPR/Cas9-3NLS/sgHMGA2@PDA, 40×; bottom: the images zoomed from 40×.

