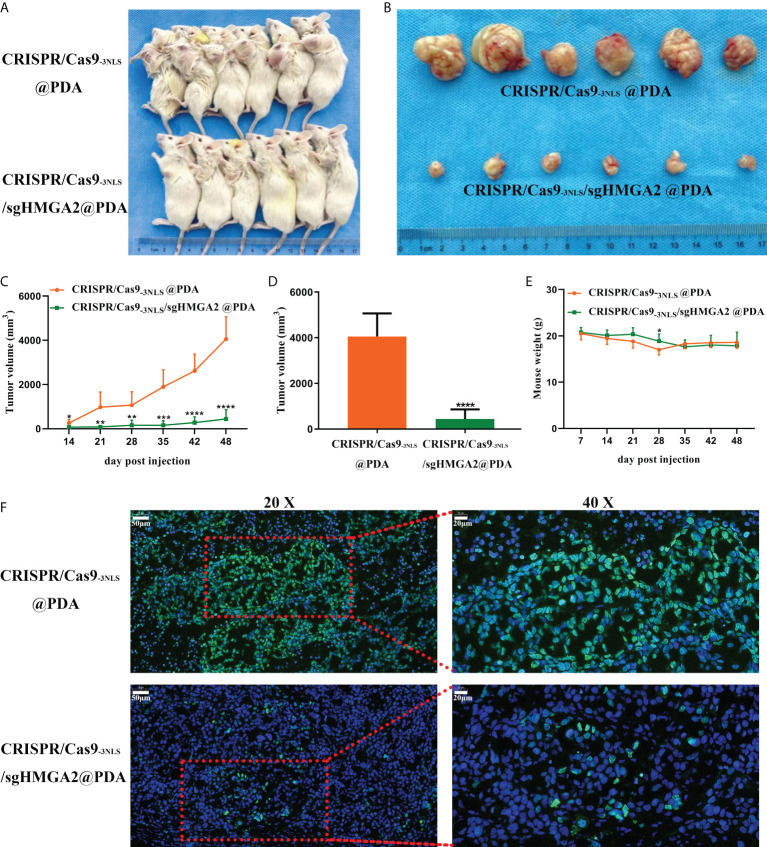
Figure 6.
The gene-cleaving effect of CRISPR/Cas9-3NLS/sgHMGA2@PDA in vivo (A, B) The tumor-bearing NOD-SCID mice and the corresponding isolated tumors. The upper line: tumor-bearing mice injected with CRISPR/Cas9-3NLS@PDA (control); the bottom line: tumor-bearing mice injected with CRISPR/Cas9-3NLS/sgHMGA2@PDA. (C) The dynamic recording of the tumor volumes. The average of six tumors was calculated each week from the 14th day to the 48th day. (D) The average volume of six isolated tumors. (E) The dynamic recording of the mouse body weight. The average of six tumor-bearing mice was calculated each week from the 14th day to the 48th day. (F) Expression of HMGA2 in the tumors isolated from the two groups of mice. The upper line: tumor-bearing mice injected with CRISPR/Cas9-3NLS@PDA (control); the bottom line: tumor-bearing mice injected with CRISPR/Cas9-3NLS/sgHMGA2@PDA; the left column: ×20; the right column: images magnified from the red frame of the left side, ×40. Green: HMGA2-positive staining, blue: nuclei staining. *P<0.05, **P<0.01, ***P<0.001, ****P<0.0001. Student’s t test. Error bars represent SD.

