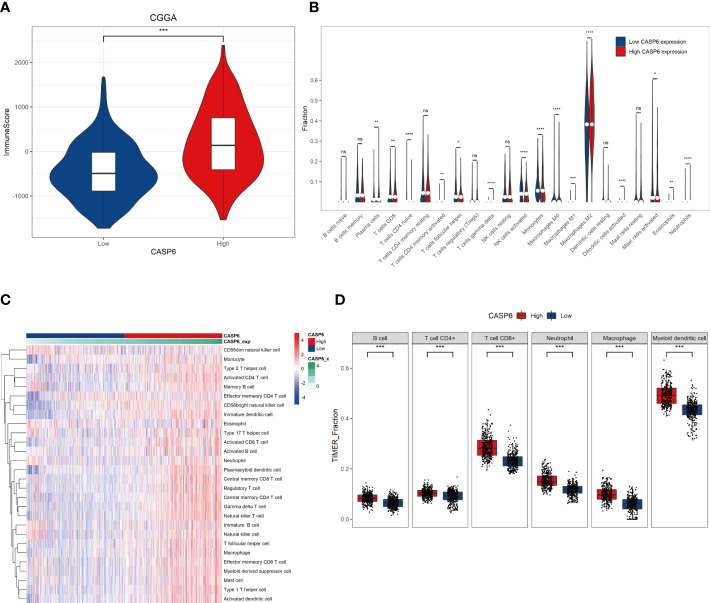
Figure 4.
Relationships with CASP6 in the tumor immune microenvironment from the CGGA database. (A) Correlation analysis of the ImmuneScore and CASP6 levels. (B) The levels of infiltration of 22 types of immune cells in the low and high CASP6 expression groups. (C) Results of ssGSEA analysis of CASP6 in the CGGA database. (D) Results of TIMER analysis of CASP6 in the CGGA database. * P < 0.05, ** P < 0.01, *** P < 0.001, **** P < 0.0001. ns, no significance.

