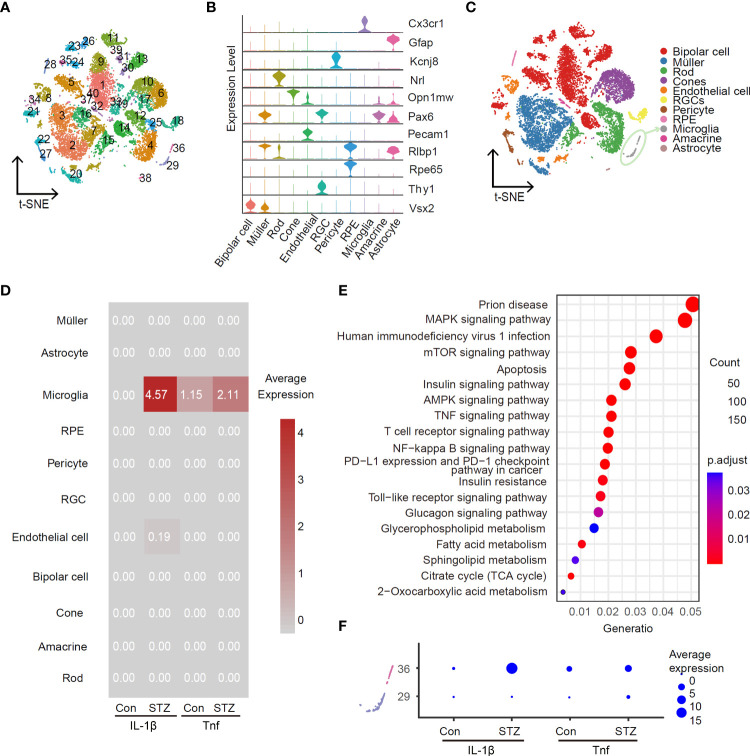
Figure 2.
Activated retinal microglia is the main source of IL-1β in the retina of STZ-induced DR mice. Feature plot in the t-SNE map of retina cells from healthy and STZ-induced diabetic mice revealing forty clusters (A) and eleven cell types (C) by scRNA-Seq program (after quality control, there were 6,126 cells in the control group and 7,851 in the STZ group). RGC, retinal ganglion cell; RPE, retinal pigment endothelial cell. (B) Violin plot of top marker genes for each cell subgroup. (D) Average expression of IL-1β and Tnf from the control and STZ groups in all subpopulations as visualized by heatmap. (E) KEGG enrichment analysis of differentially expressed genes in microglia cells between the control and STZ groups. (F) Average expression of IL-1β and Tnf in microglia subclusters 29 and 36 from the control and STZ groups as visualized by dotplot.

