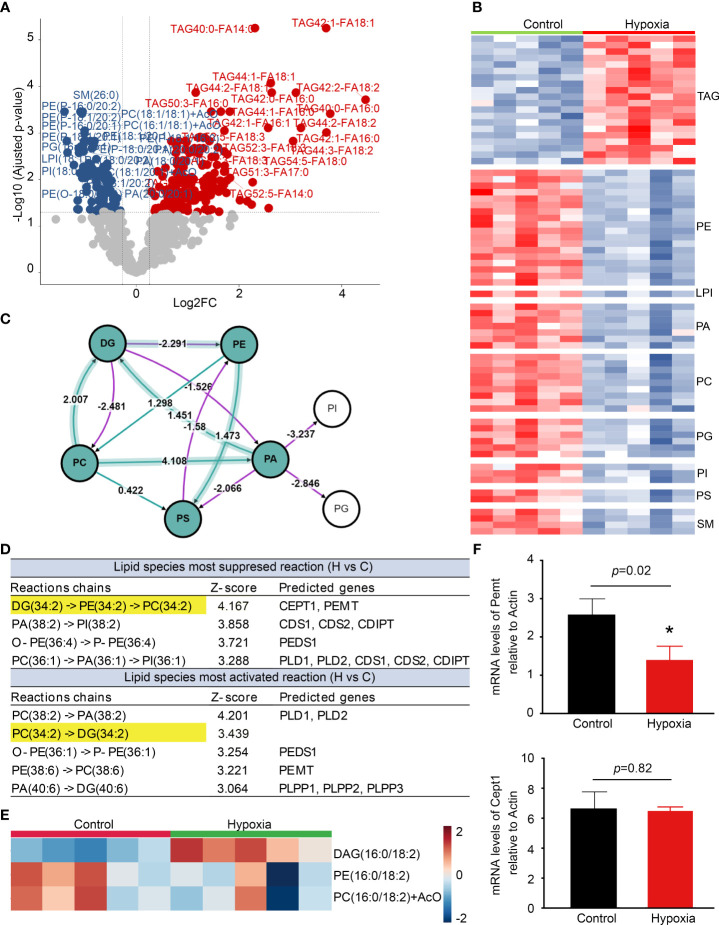
Figure 6.
Lipidomics reveals microglia activation with triacylglycerol (TAG) accumulation. (A) The volcano plot shows the comparison of cell lipids between control and hypoxia. The blue and red dots indicate lipids downregulated and upregulated under hypoxia compared with control, respectively (fold change > 1.2, p < 0.05). (B) Heatmap representation of differentially abundance lipids. (C) Analysis of differential lipid pathway induced by hypoxia stress using BioPAN. (D) Lipid species most activated and suppressed in the hypoxia group compared with control. (E) Heatmap representation of diacylglycerol (DAG) -16:0/18:2, phosphatidylethanolamine (PE) -16:0/18:2, and phosphatidylcholines (PC) -16:0/18:2 +AcO (ant colony optimization) in the hypoxia and control groups. (F) Counts-per-million (CMP) values of Pemt and Cept1 expression in the control and hypoxia groups. *p < 0.05.

