Figure 7.
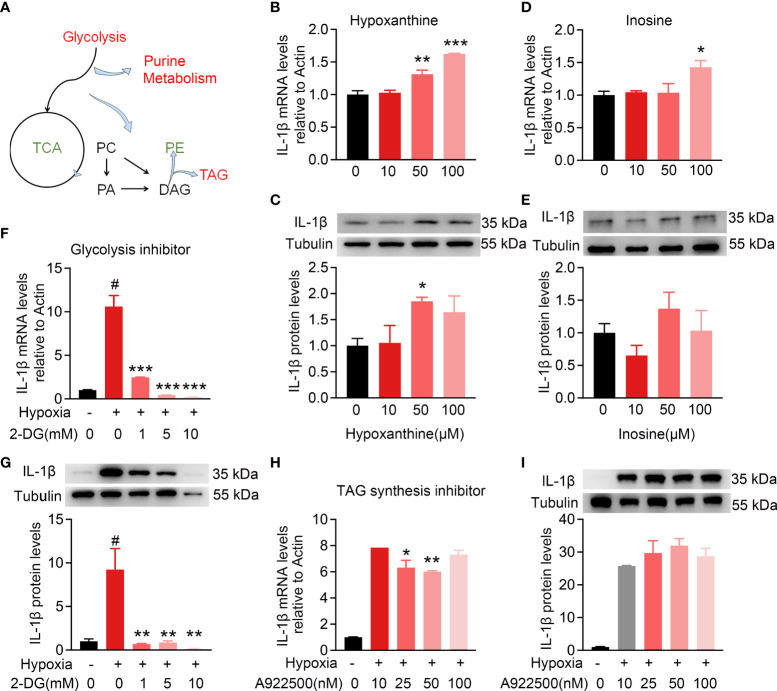
Intracellular metabolic microenvironment may regulate IL-1β expression of microglia. (A) Metabolic working model from metabolomics and lipidomics indicated hypoxia-induced microglia activation with intracellular glycolysis, purine metabolism, and TAG synthesis increase and TCA deceleration. (B–E) Purine metabolism intermediates hypoxanthine (10, 50, and 100 μM) and inosine (10, 50, and 100 μM) induced IL-1β expression in BV2 cells at different levels. (F,G) Hypoxia-induced IL-1β expression at RNA and protein level with or without glycolysis inhibitor 2-DG (1, 5, and 10 mM), respectively, using RT-PCR and Western blot. n = 3 for each group. *p < 0.05, **p < 0.01, and ***p < 0.001. (H,I) Hypoxia-induced IL-1β expression at RNA and protein levels with or without TAG synthesis inhibitor A922500 (10, 25, and 100 nM) using RT-PCR and Western blot. The meaning of # symbol is “no statistical difference”.

