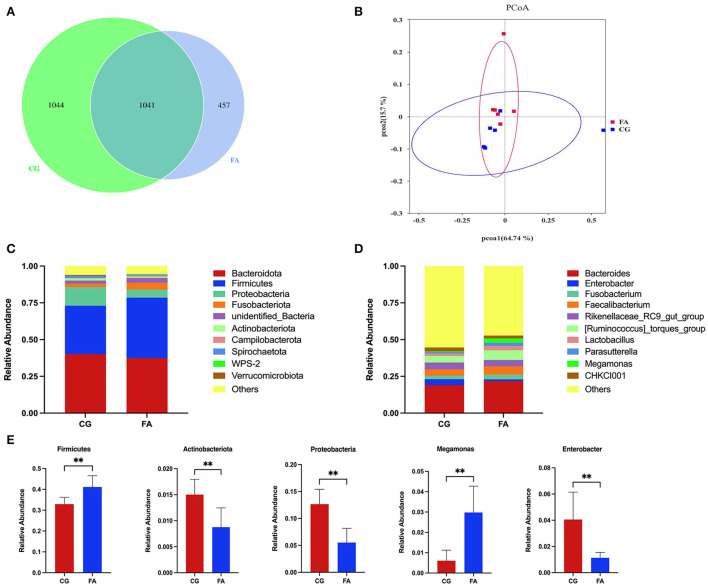
Figure 1.
Cecal contents microbial composition. (A) Venn diagram of OTUs number; (B) PCoA of the cecal microbiota; (C) Phylum-level taxonomic composition of the cecal microbiota; (D) Genus-level taxonomic composition of the cecal microbiota. (E) Relative abundance of Firmicutes, Actinobacteriota, Proteobacteria, Megamonas, and Enterobacter. CG, control group; FA, fulvic acid. Significant deviations are denoted by asterisks (**P < 0.01).

