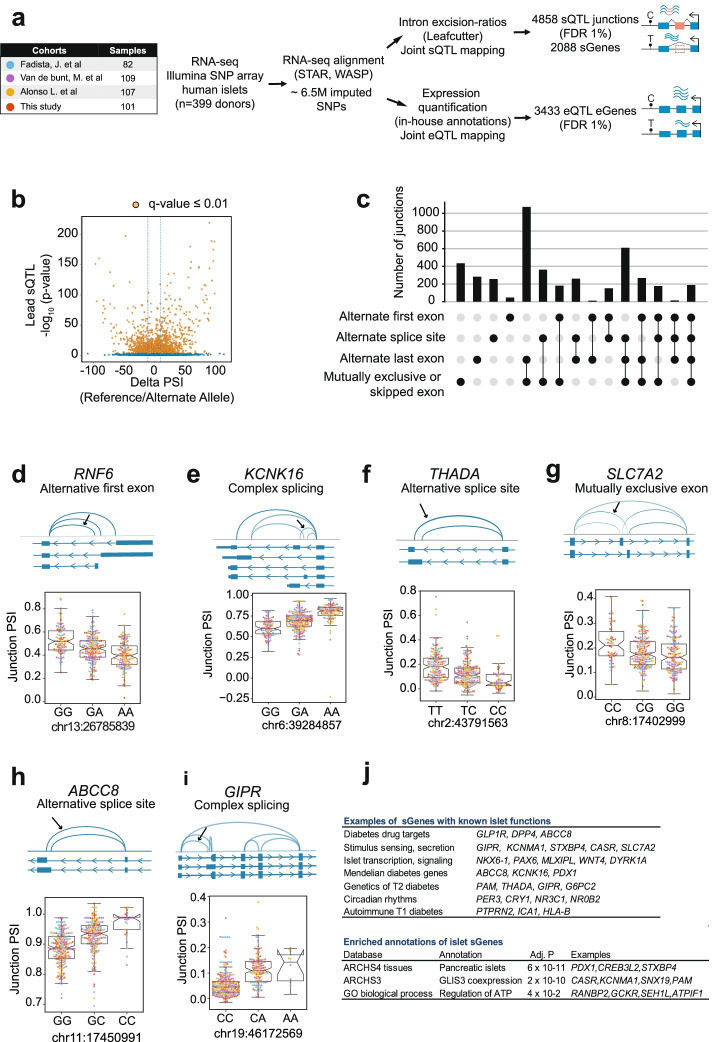
Fig. 1.
Mapping sQTLs and eQTLs in human pancreatic islets. a Overview of the study design. b Volcano plot showing the reference to alternate allele change in percentage splice index (Delta-PSI) for junctions, and sQTLs -log10 p-values. Orange dots depict sQTLs junctions with q ≤ 0.01. c Classification of sQTLs according to types of splicing events. d–i Selected examples of sGenes with different types of splicing events. An arrow signals the sQTL junction with best p-value, and adjacent boxplots show normalized, batch-corrected junction PSI values stratified by the lead sQTL genotype (IQR and 1.5 × IQR whiskers). Junction PSI values are colored according to the human islet dataset they belong to (see a). All boxplots show sQTLs with permutation p-values significant at FDR ≤ 1%, see Additional file 3: Table S2. j Functional annotations of sGenes. The top panel shows a manually curated list of examples with known functions in islet function and diabetes (see Additional file 4: Table S3); the bottom panel shows enriched annotations using EnrichR and Benjamini–Hochberg-adjusted p-values

