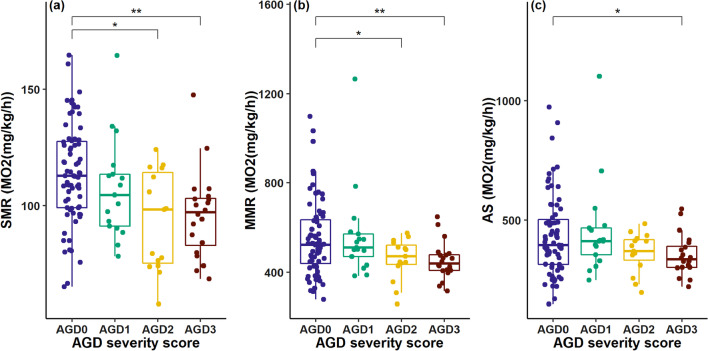
Fig. 3.
Calculated oxygen consumption (MO2(mg/kg/h)) for fish affected by AGD at different severity levels. No differentiation between genetic background was made. Standard metabolic rate (a), maximum metabolic rate (b) and aerobic scope (c). Significance was determined by pairwise t-testing against weight adjusted metabolic rate measures of fish with an AGD score of 0. P-values adjusted by Bonferroni correction. Significance codes are only shown for significant results: **p < 0.01; *p < 0.05

