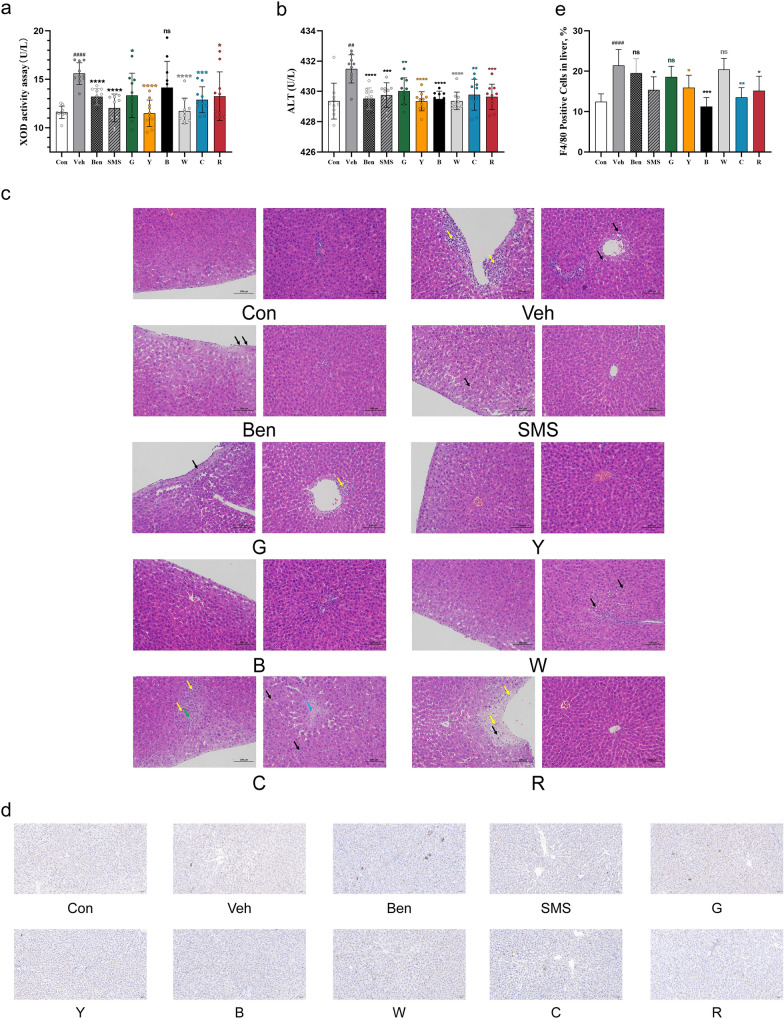
Fig. 2.
Effect of tea on the liver of rats with hyperuricaemia. a Effects of teas on hepatic XOD activity and b Serum ALT in PO- and hypoxanthine-induced hyperuricaemia in rats. Data are given as the mean ± SD (n = 10). c Hematoxylin and eosin (H&E)-stained liver tissues. Scale bars, 100 μm. The yellow, black, green, orange and blue arrows indicate inflammatory infiltration, hepatocyte steatosis, hepatocyte death, fibroproliferative lesions around the central veins and capsular fibroproliferative lesions, respectively. d Immunohistochemical staining for F4/80 in liver tissue. Scale bars, 50 μm. e Quantification of the proportion of F4/80 -positive cells in the liver. #Represents a significant difference compared with the Con group, ##P < 0.01; ####P < 0.0001; *represents a significant difference compared with the Veh group, *P < 0.05, **P < 0.01, ***P < 0.001,****P < 0.0001

