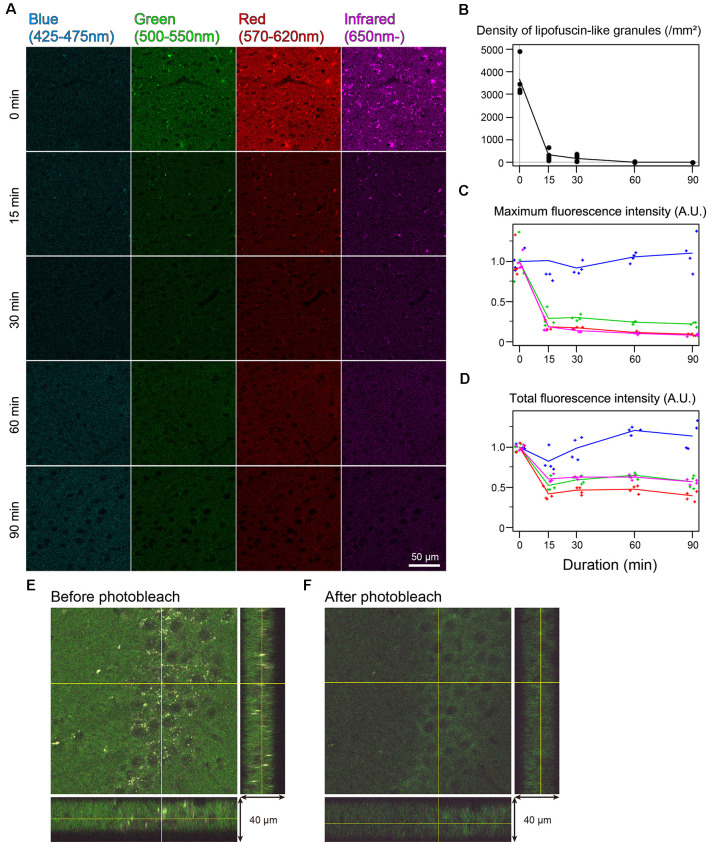
Figure 2.
Rapid quenching of autofluorescence in the mouse cingulate cortex by photobleaching using TiYOTM. (A) Change in autofluorescence according to the duration of photobleaching. Each row shows photos from different specimens. Scale bar: 50 μm. (B) The density of lipofuscin-like granules. (C) Maximum fluorescence intensity. (D) Total fluorescence intensity. (B–D) Dots and lines represent the measured values and their means, respectively. Fluorescence intensities are shown as arbitrary units (A.U.). (E,F) Orthogonal views of the same 40 μm-thick section before (E) and after photobleaching (F).

