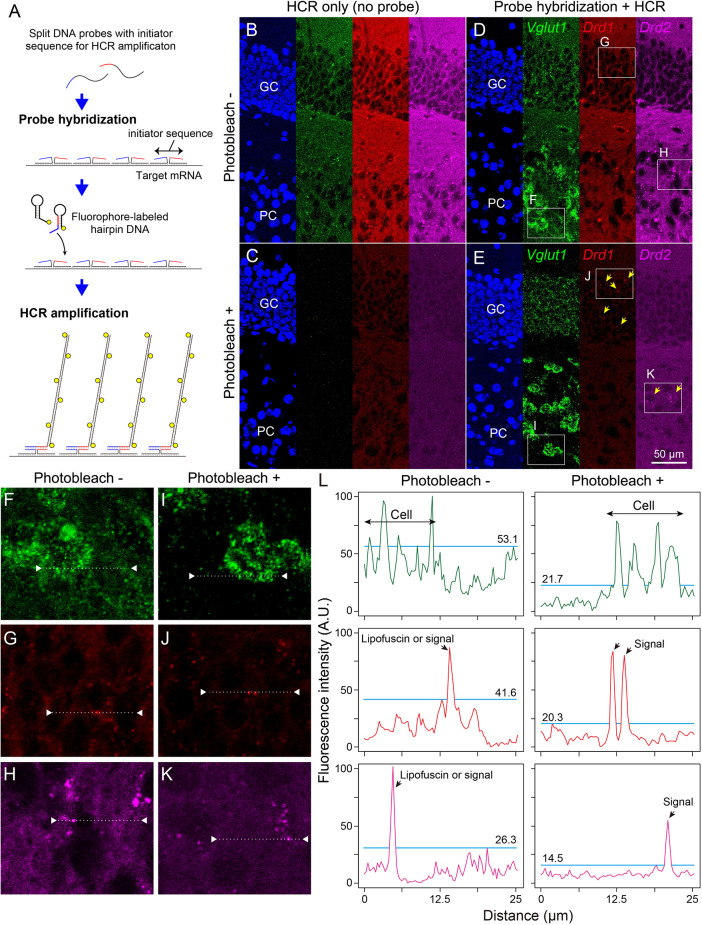
Figure 3.
Effect of photobleaching on the signal/noise ratio of ISH-HCR staining. (A) Schematic drawings describing ISH-HCR staining in this study. ISH-HCR consists of two steps: hybridization of split DNA probes and HCR amplification of fluorophore-labeled hairpin DNAs. HCR amplification starts only in the case that both split probes are hybridized with target mRNA. In the HCR amplification step, a pair of fluorophore-labeled hairpin DNAs polymerize on the hybridized probes with complete initiator sequences. For details, see Tsuneoka and Funato (2020). (B–E) Representative photomicrograph of ISH-HCR staining for Vglut1 (green), Drd1 (red), and Drd2 (magenta) mRNAs in addition to Hoechst 33342 nuclear staining (blue) in the dentate gyrus of the mouse hippocampus. No probe control without photobleaching (B) and with photobleaching (C). ISH-HCR staining of Vglut1, Drd1, and Drd2 without photobleaching (D) and with photobleaching (E). Arrows indicate Drd1- or Drd2-positive cells. Scale bar: 50 μm. GC, granule cell layer; PC, polymorph cell layer. (F–K) Magnified views indicated by rectangles in (D,E). (L) Line profile of fluorescent intensity indicated by dotted lines and triangles on (F–K). Light blue lines indicate the maximum intensity of background signals. Fluorescence intensities are shown as arbitrary units (A.U.).

