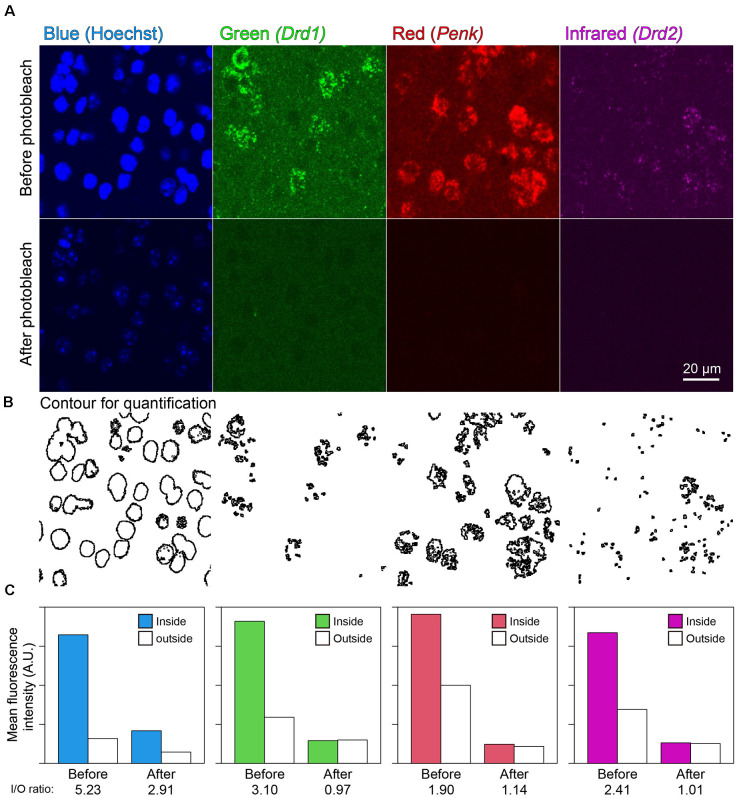
Figure 4.
Effect of photobleaching on the fluorescence of ISH-HCR. (A) Mouse striatal tissue stained with Drd1, Penk, and Drd2 mRNA in addition to Hoechst 33342 nuclear staining. The upper panels show confocal images before photobleaching, and the lower panels show confocal images in the same location after photobleaching. Scale bar: 20 μm. (B) Contour for quantification of signal to background ratio change shown in (C). (C) Bar plots show mean fluorescence intensity inside or outside the contour. The inside/outside ratio of fluorescence intensity are shown at bottom line.

