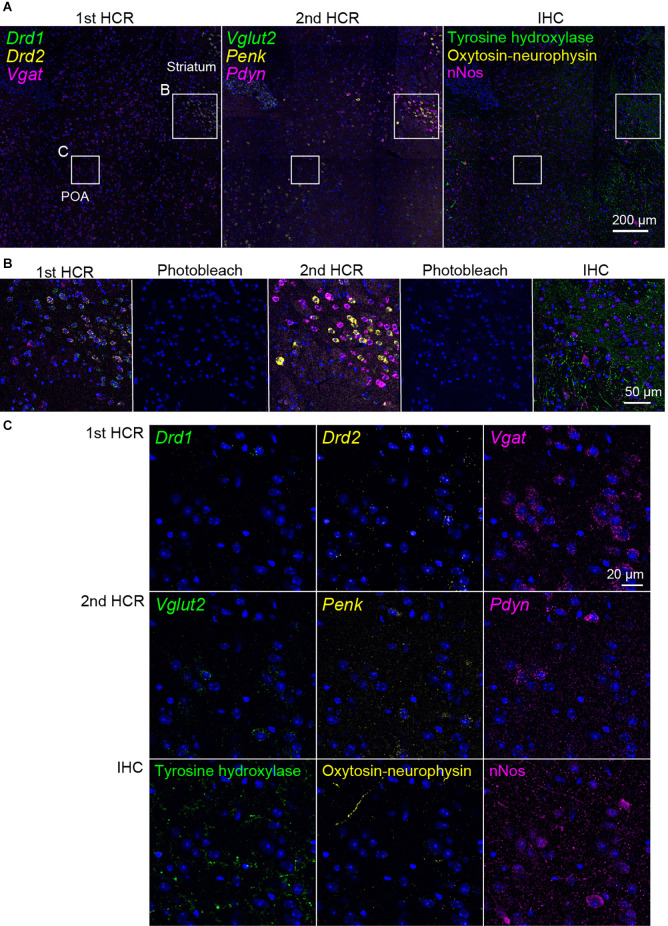
Figure 6.
Representative photomicrographs of two-round ISH-IHC. The first HCR visualized Drd1 (green, S41-SaraFluor488), Drd2 (yellow, S23-Atto550), and Vgat (magenta, S68-Cy5) mRNAs. The second HCR visualized Vglut2 (green, S45-SaraFluor488), Penk (yellow, A161-Atto550), and Pdyn (magenta, S85-Cy5) mRNAs. In the IHC, tyrosine hydroxylase, oxytocin-neurophysin, and nNos were visualized by Alexa488, Alexa568, and Alexa647 secondary antibodies, respectively. (A) Merged low-magnification images of mouse sections, including the preoptic area (POA) and striatum. Rectangles indicate the regions shown in (B,C). Scale bar: 200 μm. (B) Merged, sequential images of the first HCR, photobleached image, the second HCR, photobleached image, and IHC. Scale bar: 50 μm. (C) Separate high-magnification images of each molecule. Scale bar: 20 μm.

