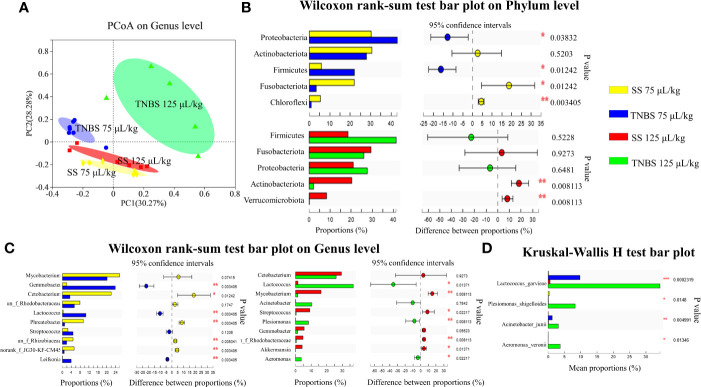
Figure 3.
The effect of TNBS on the intestinal microbiota. (A) The principal co-ordinates analysis (PCoA) on genus level. (B) Relative abundance on Phylum level (top 5). (C) Relative abundance on Genu level (top 10). (D) Relative abundance of 4 pathogenic bacteria. N = 6 at least. P value was calculated by Student’s t tests. *P< 0.05, **P < 0.01, ***P < 0.001 compared with PBS groups.

