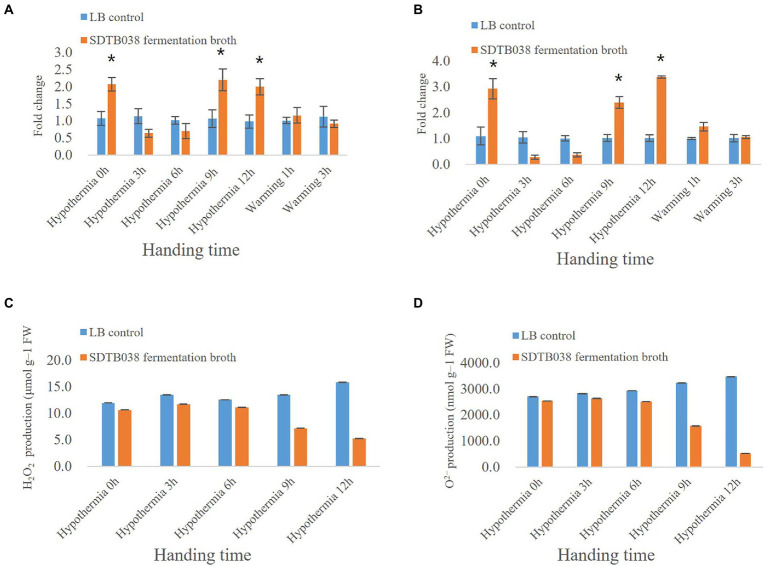
Figure 5.
Expression of enzyme activity genes and changes of H2O2 and O2− Content. (A) CAT expression; (B) SOD expression; (C) Changes of H2O2 Content; (D) Changes of O2− Content. Asterisks indicate significant differences between tomato plants inoculated with SDTB038 broth and those inoculated with liquid LB. The different lowercases represent significant level (p = 0.05) according to the Duncan’s test.

