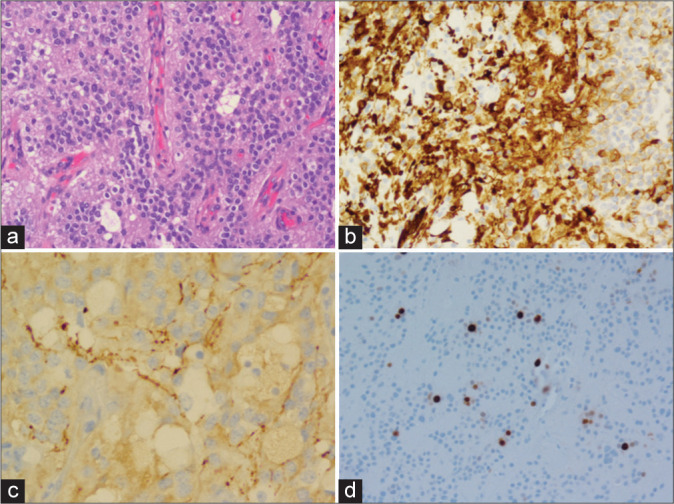
Figure 4:

Histopathologic slides of the second recurrent liponeurocytoma (a) show small, microscopic collections of fat with increased vascularity and cellularity compared to the first recurrent tumor. (b) Small tumor cells with mixed lipomatous differentiated neoplastic cells express synaptophysin. (c) Axons of the surrounding central nervous system tissue express neurofilament. (d) The Ki-67 proliferation index (as determined by MIB-1 staining) is 7.4%.
