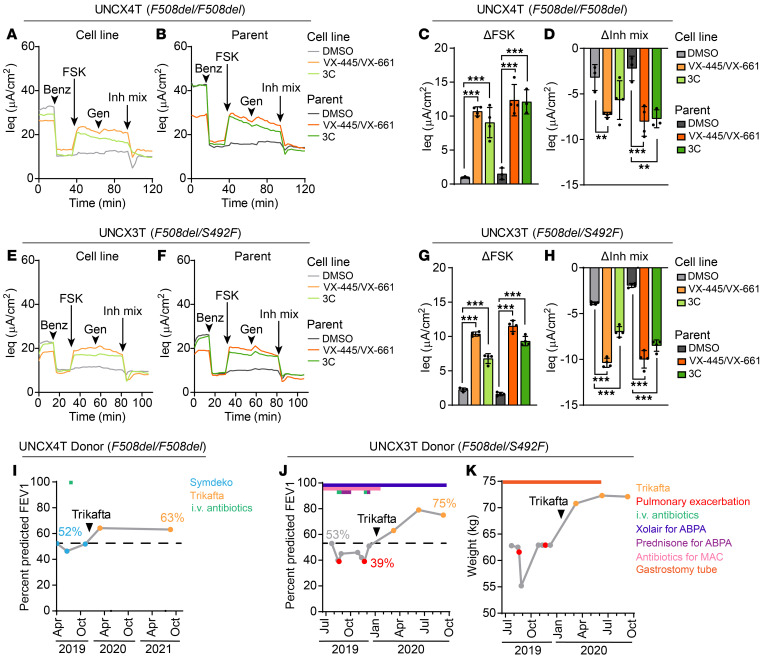
Figure 2. Nasal cell lines predict primary cell and clinical response to CFTR modulators.
(A and B) TECC-24 tracings of the UNCX4T nasal cell line (F508del/F508del) (A) and parent primary cells (B) treated with 0.1% DMSO and VX-445 and VX-661 (each at 5 μM), or a triple corrector combination (3C) containing VX-809/3151/4172 (each at 5 μM). Tracings are representative of 3–4 replicates. Acute addition of the potentiator 10 μM genistein is indicated by arrows. (C and D) ΔIeq of UNCX4T and parent cells in response to FSK (C) and the inhibitor mixture (D). n = 3–4. (E and F) TECC-24 tracings of the UNCX3T nasal cell line (F508del/S492F) (E) and parent primary cells (F) pretreated with DMSO, VX-445 and VX-661, or 3C. Tracings are representative of 3–4 replicates. (G and H) ΔIeq of UNCX3T and parent cells in response to FSK (G) and the inhibitor mixture (H). n = 3–4. (I) Change in the percentage of predicted FEV1 before and after Trikafta initiation in the UNCX4T donor (I) and the UNCX3T donor (J). Blue data points indicate FEV1 measured during SYMDEKO therapy, orange data points indicate FEV1 measured during Trikafta therapy, and red data points indicate FEV1 measured during a CF exacerbation. The treatment course for the UNCX4T and UNCX3T donors is indicated above the respective FEV1 plots and includes the timeline of i.v. antibiotics (green), XOLAIR for ABPA (dark blue), prednisone for ABPA (purple), antibiotics for treatment of Mycobacterium avium complex (MAC) (pink). (K) Change in weight in kilograms of the UNCX3T cell donor after Trikafta initiation. Gastrostomy tube use and subsequent removal are indicated by an orange bar. All data were analyzed using an ordinary linear model and are presented as the mean ± SD. Post hoc comparisons were performed using the general linear hypothesis test. **P < 0.01 and ***P < 0.001.

