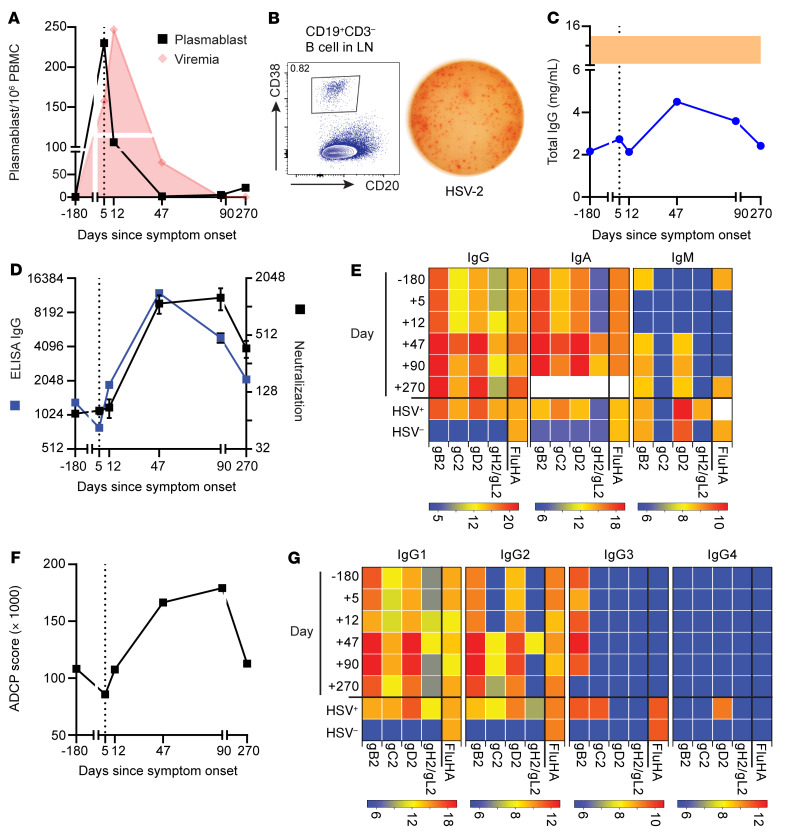
Figure 2. Vigorous HSV-specific B cell responses were observed in the blood and LN.
(A) Quantification of plasmablasts per million live PBMCs in the blood over time. Red indicates the viral titer depicted in Figure 1C. (B) Flow cytometric analysis shows plasmablasts in the LN (left). ELISPOT assay (right) shows that LN plasmablasts secreted HSV-2–specific IgG antibodies. (C) Persistent hypogammaglobulinemia was observed in this patient. Shaded area indicates the expected normal range. (D) Relative IgG-binding titers against HSV-2 lysates by ELISA (blue) and neutralizing antibody titers leading to a 50% reduction in virus infectivity (black). Error bars indicate the SEM. Positive control neutralizing antibody titer = 1:256. (E) IgG, IgA, and IgM antibody binding to different HSV-2 surface proteins at each time point versus pooled plasma from HSV-2+ and HSV-1/-2– controls. White denotes the sample not analyzed. (F) HSV-2 ADCP score (in thousands) of gD2-covered microspheres incubated with plasma from each time point. ADCP score for pooled healthy HSV-2+ control = 111,320. Error bars indicate the SD. (G) IgG subclass analysis of antibodies that bound to HSV-2 surface proteins at each time point versus pooled plasma from HSV-2+ and HSV-1/-2– controls. For E and G, antibody binding to influenza HA (FluHA) was included as a control. Heatmap scale reflects the endpoint titer in log2. All measurements were performed in duplicate. For all applicable graphs, the vertical dotted line indicates the time of presentation. Day, days since symptom onset.

