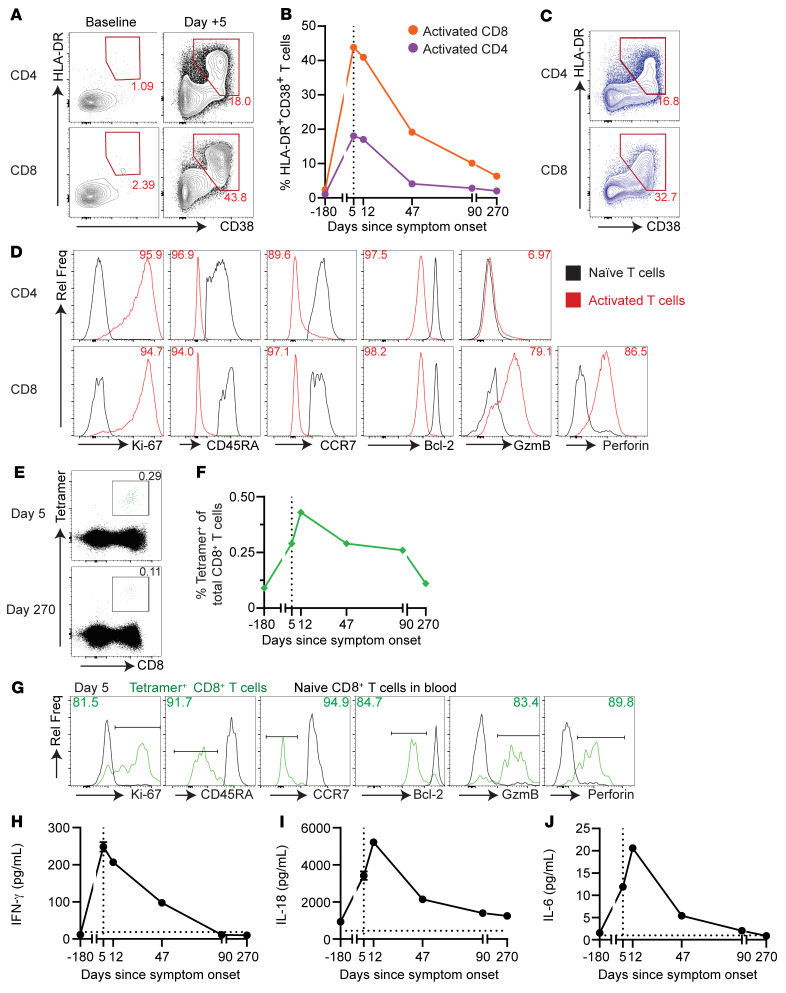
Figure 3. Robust T cell and plasma cytokine responses were observed.
(A) FACS plots of singlet, live, CD3+, CD4+, and CD8+ lymphocytes at baseline and on day +5, identifying activated HLA-DR+CD38+ T cells. (B) Percentage of activated CD4+ (purple) and CD8+ (orange) T cells over time as analyzed in A. (C) FACS analysis showing a high percentage of activated CD4+ and CD8+ T cells in the LN. Numbers in A and C denote the percentage of total CD4+ or CD8+ T cells. (D) CD38+HLA-DR+ T cells in the blood (red) had an effector phenotype. Numbers denote a percentage of activated CD4+ or CD8+ T cells expressing or downregulating the marker of interest. Naive (black) CD4+ or CD8+ T cells are shown as a control. All gates were set in reference to naive CD4+ or CD8+ T cells. (E) UL-25 tetramer staining in the blood on day +5 and day +270. Numbers denote the percentage of total CD8+ T cells. (F) Percentage of HSV-2 UL-25–specific tetramer+CD8+ T cells in the blood over time. (G) Extended phenotype analysis of UL-25 tetramer+CD8+ T cells in the blood on day 5. Green indicates UL-25 tetramer+CD8+ T cells; black indicates naive CD8+ T cells. Numbers indicate the percentage of tetramer+ (green) CD8+ T cells. Mean plasma levels of proinflammatory cytokines IFN-γ (H), IL-18 (I), and IL-6 (J) were elevated in the acute setting. All measurements were performed in quadruplicate. Error bars indicate the SD. Horizontal dotted line indicates the levels in pooled plasma from aged-matched healthy individuals. For all applicable graphs, the vertical dotted line indicates the time of presentation. Day, days since symptom onset. Rel Freq, relative frequency.

