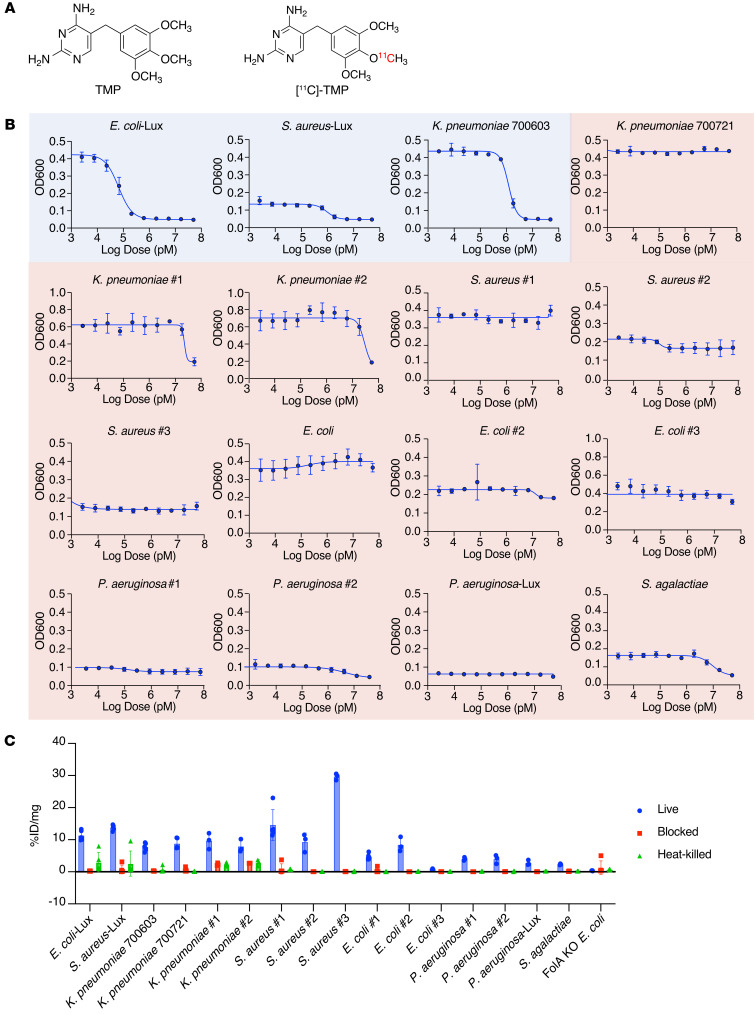
Figure 1. Structure of [11C]-TMP and in vitro TMP dose-response assays of different bacterial strains.
(A) Structures of trimethoprim (TMP) and [11C]-TMP. (B) TMP dose-response assay on bacterial strains. OD600 measurement was taken following a 6-hour incubation of different bacterial strains with TMP. The susceptibility or resistance of a bacterial strain to TMP is color-coded based on the IC50 and minimum inhibitory concentration (MIC). Blue indicates susceptible bacteria, and red indicates resistant bacteria. n = 3; data represent mean ± SD. (C) Representative [11C]-TMP uptake in bacterial cultures after a 30-minute incubation at 37°C. n = 3–5; data represent mean ± SD. The experiment was repeated a total of 2–3 times for biological replicates.

