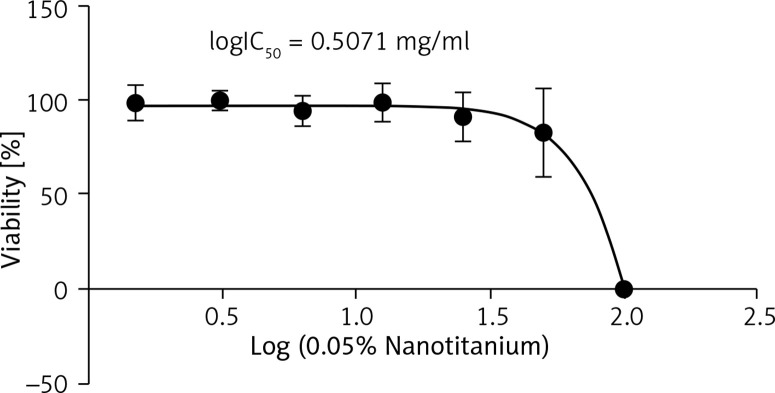
Figure 2.
Determination of IC50 using MTT assay at 24 h. The curve was constructed by GraphPad Prism software version 6 using non-linear regression analysis to construct the curve of 0.05% nanotitania extract at different concentrations and the provided inhibitory effect on L929 cells with an IC50 value of 3.215 mg/ml at 24 h (R2 = 0.9157)

