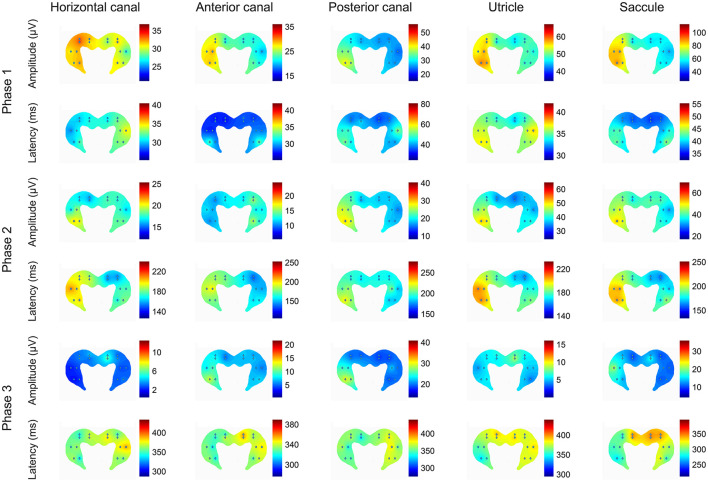
Figure 7.
Heat plots of the patterns of amplitudes and latencies of the 3 phases of the local field potentials (LFPs) evoked in the hippocampus by electrical stimulation of the horizontal canal (HC), anterior canal (AC) or posterior canal (PC) ampullae, or the utricle or saccule, where the hot colors represent the highest amplitudes and the longest latencies. The heat maps represent the data from all of the rats used in the experiments. The left side on the figures represents the right hippocampus and is contralateral to the stimulation. This is a heatmap scaled by itself, i.e., every single heatmap has maximum and minimum colors. The advantage of this heatmap is that it helps to understand how stimulation of the different sensors activates different areas of the hippocampus. The stimulus used was 300 μA at 400 Hz in all cases. Reproduced with permission from Hitier et al. (38).

