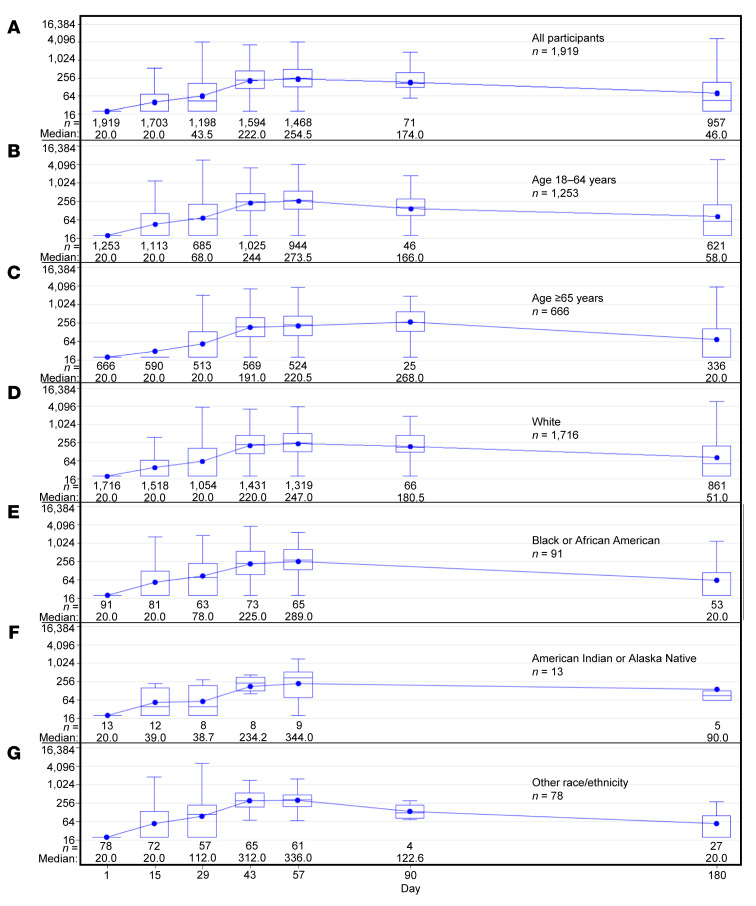
Figure 5. Neutralizing antibody responses over time in the AZD1222 group in the immunogenicity substudy population.
Box and whisker plots showing SARS-CoV-2 neutralizing antibody quantitation over time, (A) overall, and by (B and C) age and (D–G) race/ethnicity (data on race/ethnicity missing for n = 21 participants). Participants were censored at the earliest date of nonstudy COVID-19 vaccination, positive test for SARS-CoV-2 nucleocapsid antibodies, RT-PCR–positive SARS-CoV-2 symptomatic infection, or last trial contact. The y axes shows 1/dilution; for conversion to the WHO International Standard, see Supplemental Methods. Box indicates interquartile range, whiskers indicate range, horizontal line in box indicates median, and dot in box indicates mean.

