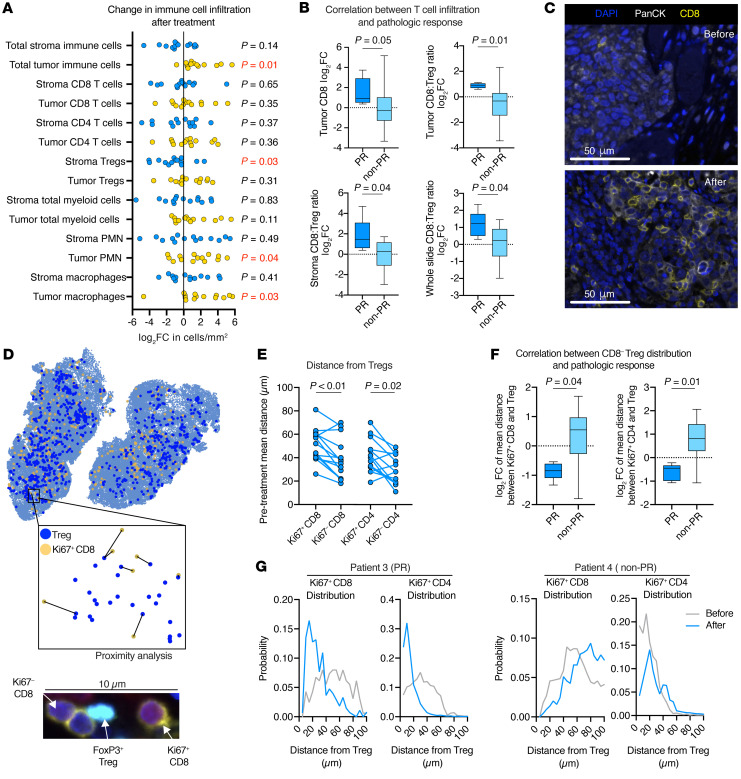
Figure 4. MIF analysis of tumor T cell infiltration and spatial distribution.
(A) Dot plot shows the log2 FC in immune cell density (cells/mm2) in the stroma or tumor parenchyma after treatment compared with before treatment (n = 14). Significance was determined with a 1-sample t test; P values in red are significant. (B) Box-and-whisker plots show the log2 FC in tumor CD8+ density as well as the tumor, stroma, and whole-slide CD8/Treg ratio after treatment compared with before treatment in patients who did (n = 5) or did not (n = 9) show a PR. Significance was determined with a 2-tailed Mann-Whitney U test. (C) Representative high-magnification photomicrographs of CD8+ staining for patient 3, who had a large increase in tumor CD8+ T cell infiltration after treatment compared with before treatment. Scale bars: 50 μm. (D) Representative image of a HALO spatial plot used to perform proximity analysis (inset) of FoxP3– T cells and FoxP3+ Tregs. A representative photomicrograph of a Treg directly interacting with a Ki67–CD8+ T cell is shown below. (E) Assessment of FoxP3–CD8+ or CD4+ T cells within a 100 μM radius of all FoxP3+CD4+ Tregs, with dot plot showing the mean distance between Ki67+ or Ki67– CD8+ or CD4+ T cells and Tregs in pretreatment tumors as determined by MIF (n = 14). Lines connect pre- and post-treatment measurements from individual tumors. Significance was determined with a Wilcoxon signed-rank test. (F) Assessment of all FoxP3–CD8+ or CD4+ T cells within a 100 μM radius of all FoxP3+CD4+ Tregs. Box-and-whisker plots show the log2 FC in the mean distance between Ki67+CD8+ or CD4+ T cells and Tregs after treatment compared with before treatment in patients who did (n = 5) or did not (n = 9) have a PR. Significance determined with a 2-tailed Mann-Whitney U test. (G) Distribution plots show the probability that a Ki67+CD8+ or CD4+ T cell will be at a given distance from a Treg in pretreatment (gray line) and post-treatment (blue line) tumors. Patient 3 is a representative example of a patient who developed a PR; patient 4 did not develop a PR.

