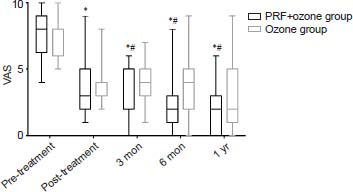
Figure 3.

The changes of VAS at each evaluative time point in PRF + ozone and ozone groups
Note: Results are presented as median with range. *P < 0.05, vs. pre-treatment; #P < 0.05, vs. ozone group (Friedman test). PHN: Postherpetic neuralgia; PRF: pulsed radiofrequency; VAS: visual analog scale.
