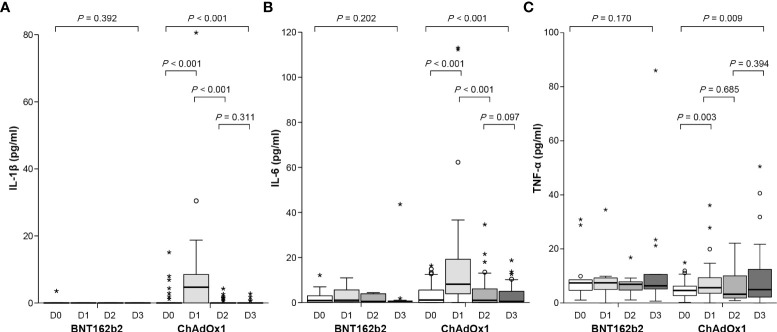
Figure 4.
Concentration of proinflammatory cytokines before and after the first and second dose of ChAdOx1 nCoV-19 and BNT162b2: (A) IL-1β, (B) IL-6, and (C) TNF-α. Before the first dose (D0), day 3 after the first dose (D1), before the second dose (D2), and day 3 after the second dose (D3). Symbol * within graph is data value along with °.

