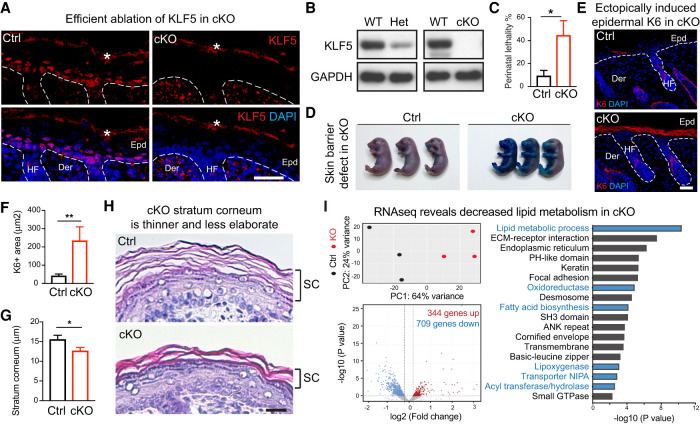
Figure 2.
KLF5 is essential for epidermal function in vivo. All images are representative and from at least five biologically independent replicates. White dashed lines on IF images denote the epidermal–dermal border. (Epd) Epidermis, (HF) hair follicle, (Der) dermis, (WT) wild-type mice, (Het) heterozygous loss mice, (cKO) homozygous loss mice, (Ctrl) control mice (heterozygous loss). (A) IF demonstrates that KLF5 protein is selectively lost in cKO epidermis compared with Ctrl at postnatal day 0. The asterisk denotes background signals at the stratum corneum layers. Scale bar, 50 µm. (B) Western blot analysis shows KLF5 protein is decreased in epidermal cells of heterozygous loss animals (Het) and completely lost in those of cKO compared with WT (wild type). GAPDH served as loading control. (C) Increased perinatal lethality in cKO compared with Ctrl (n = 11 for each group). (D) Toluidine Blue O dye exclusion assay shows cKO failed to exclude dye at embryonic day 18.5, while those from the Ctrl group formed an intact barrier and were able to exclude dye completely. (E,F) IF of KERATIN 6 (K6) and quantifications reveal that K6 protein is strongly induced in cKO epidermis (Ctrl: n = 23; cKO: n = 25). Note the normal expression of K6 in the hair follicle inner root sheath lineage in both Ctrl and cKO sections. Scale bar, 50 µm. (G,H) Hematoxylin and eosin stainings of postnatal day 0 skin sections show notable thinning of the stratum corneum in cKO compared with its elaborate basket weave appearance in Ctrl (Ctrl: n = 18; cKO: n = 25). Scale bar, 60 µm. Dashed line frames show the regions magnified. Scale bar, 20 µm. (C,F,G) Unpaired t-test. (*) P < 0.05, (**) P < 0.01. (I) Bulk RNA-seq was performed on Ctrl and cKO epidermis. Dispase was used to separate epidermis from dermis, dermis was discarded, and epidermis was trypsinized to obtained single-cell resuspensions, which were subjected to FACS sorting that excluded DAPI (dead) and CD45 (immune), and enriched for GFP (epithelial lineage marked by K14Cre;R26YFPfl/fl) and Integrin α6+ basal and suprabasal epithelial cells. (Top left) Principal component analysis showing three Ctrl and three KO samples. (Bottom left) Volcano plot showing differentially expressed genes (709 down-regulated and 344 up-regulated) in cKO compared with the Ctrl (heterozygous) group using P < 0.05 and absolute log2 fold change of >0.2 as the cutoff. (Right) Gene ontology analysis using Database for Annotation, Visualization, and Integrated Discovery (DAVID) reveals that both lipid metabolic process and epidermal development pathways are deregulated in cKO epidermis.

