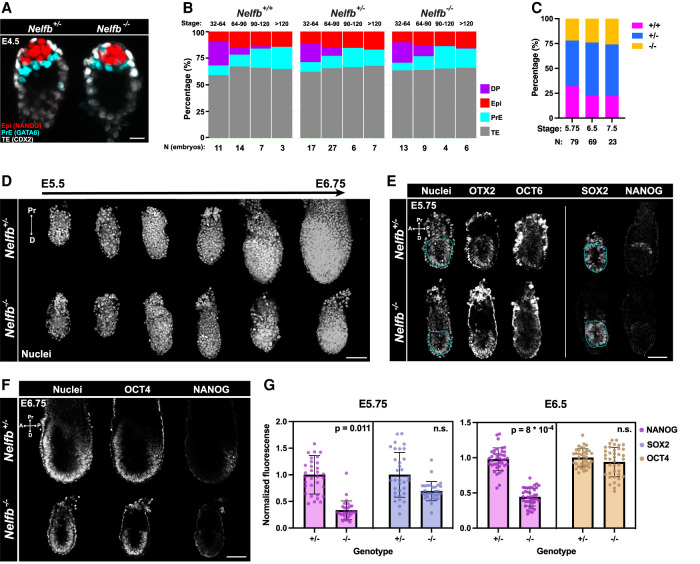
Figure 1.
Nelfb−/− embryos display defects in pluripotent epiblast state transitions. (A) Immunofluorescence of E4.5 blastocysts labeling epiblast (NANOG), primitive endoderm (GATA6), and trophectoderm (CDX2). Several Z slices are shown in maximum intensity projection (MIP) to show the ICM. Scale bar, 15 μm. (B) Stacked bar plot representing the percentage of each lineage in blastocysts sorted by stage, total cell number per blastocyst, and genotype. (C) Stacked bar plot representing percentage of each Nelfb genotype at different postimplantation stages. (D) Maximum intensity projection (MIP) of embryos dissected at stages between E5.5 and E6.75 at 0.25-d increments. Nuclei are shown to reflect whole embryo. Nuclei were labeled with Hoechst. Scale bar, 100 μm. (E) Immunofluorescence of E5.75 embryos of select pluripotency markers. The bordered region highlights the epiblast cup. The vertical line means separate embryos. Single Z slices are shown. Scale bar, 50 μm. (F) Immunofluorescence of E6.75 embryos of select pluripotency markers. Nuclei were labeled with Hoechst. Single Z slices are shown. Scale bar, 100 μm. (G) Normalized immunofluorescence intensity per epiblast nucleus for pluripotency markers. Single dots are single nuclei. Quantifications show four embryos per group. Statistical testing using t-test was performed on embryo averages. Error bars show standard deviation. P < 0.05 was used to determine significance.

