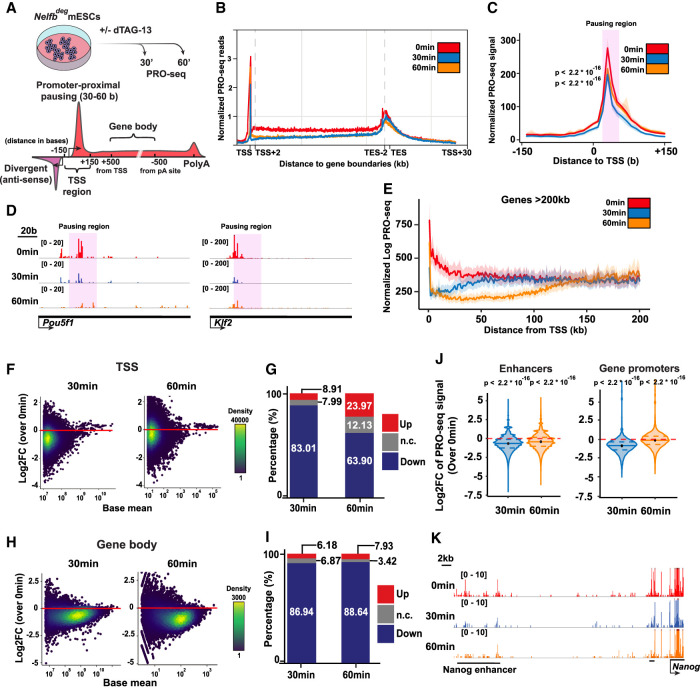
Figure 4.
NELF stabilizes Pol II pausing and transcription at promoters and enhancers. (A) Schematic of treatments of 30 and 60 min before PRO-seq analysis (top), and regions of each defined DNA element in the following analysis (bottom). (B) Metaplot of scaled protein-coding genes’ PRO-seq signal relative to TSSs and TESs. (C) Metaplot of PRO-seq signal at TSSs. The highlighted region marks the proximal-pausing region. Statistical testing was performed using Wilcoxon and paired t-tests with similar results. (D) Genome browser shot of TSS regions of example pluripotency genes. The highlighted region marks the proximal-pausing region. (E) Metaplot of PRO-seq signal at genes >200 kb. (F) Log2 fold change of PRO-seq signal at TSSs calculated using DEseq2. (G) Bar plot showing the percentage of up, down, and unchanged loci in F. Padj of 0.05 was used as a cutoff. (H) Log2 fold change of PRO-seq signal at gene bodies calculated using DEseq2. (I) Bar plot showing the percentage of up, down, and unchanged loci in H. Padj of 0.05 was used as a cutoff. (J) Violin plot of TSS log2 fold change data in F separated by enhancer versus protein-coding gene TSSs. Plots show mean, 25th percentile, and 75th percentile inside each violin plot. Statistical testing was performed using Wilcoxon and paired t-tests with similar results. (K) Genome browser shot of an example enhancer signal across treatments.

