Figure 5.
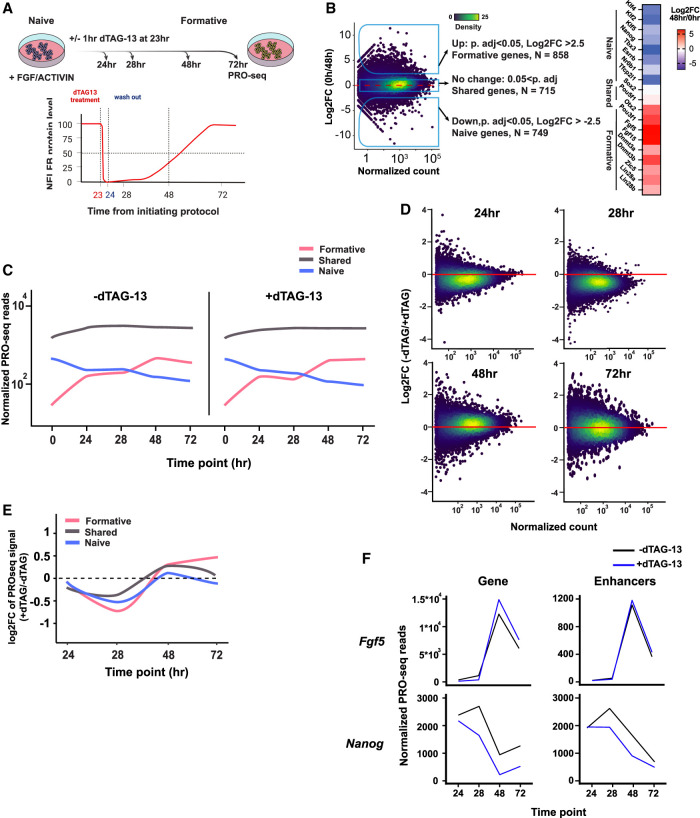
NELF balances gene induction and repression during pluripotency transitions. (A, top) Schematic of experiment and analysis time points. (Bottom) Schematic of NELFB protein levels during the experiment following transient depletion. (B, left) Log2 fold change of PRO-seq data for gene expression between 0 and 48 h, which was used to define naïve genes, formative genes, and shared genes. (Right) Heat map of log2 fold change of known naïve and formative markers. (C) Mean normalized PRO-seq reads per gene in each gene class during the transition. Full data range is shown in Supplemental Figure S5A, and heat maps are in Supplemental Figure S5B. (D) Log2 fold change of PRO-seq data for gene expression at each time point of the analysis using DEseq2. (E) Mean log2 fold change of PRO-seq data for gene expression at each time point of the analysis per gene group. Full data range is shown in Supplemental Figure S5C. (F) Normalized gene expression/reads from PRO-seq data at candidate genes and their associated enhancers during the transition protocol. Other genes are shown in Supplemental Figure S5F.

